Determining Perforation Tunnel Impairment Productivity Using Computed Tomography

a perforation tunnel and productivity technology, applied in the direction of material analysis using wave/particle radiation, instruments, borehole/well accessories, etc., can solve the problems of completely blocking the flow in the affected area, damage to the rock matrix surrounding the perforation tunnel, and non-uniform thickness of the damaged area

Inactive Publication Date: 2015-12-03
HALLIBURTON ENERGY SERVICES INC
View PDF7 Cites 3 Cited by
  • Summary
  • Abstract
  • Description
  • Claims
  • Application Information

AI Technical Summary

Benefits of technology

The present invention is a method and apparatus to record the properties of fluid transport in perforation samples according to API RP 19B Section 4 procedures. The invention uses tomographic images to create three-dimensional models of the crush zone and flow through the sample. The tomographic data is processed to evaluate the flow performance of the perforation under various formation stimulus treatments. The technical effect of the invention is to provide a more accurate understanding of fluid transport in perforation samples and to optimize the performance of oil and gas wells.

Problems solved by technology

During jet perforation and other well treatments, some damage occurs to the rock matrix surrounding the perforation tunnel.
Indeed, charge and core debris can be present in an area of the perforation and can completely block flow in that area.
It has been found that the damaged area is of non-uniform thickness that varies along the length of the perforation tunnel.
It has also been found that the permeability of the crush zone can be further damaged by well treatments and production.
The damaged rock in the crush zone has fluid flow characteristics (permeability) which are inferior to the undisturbed rock matrix.
This reduction in permeability in the perforation crush zone reduces the optimum flow into the well from the perforation.
While the crush zone damage varies along the length of the perforation there are no methods to accurately measure the local damage or local effect of this damage on permeability.
However, there is no reasonable means for measuring and isolating all fluid transport properties, for example, flow through a particular wall area or portion of the tunnel, flow by direction within the sample, flow through damage to the formation at and around the perforation tunnel.
Indeed, current laboratory evaluation methods of fluid transport properties are not only difficult and expensive, but are limited in nature.

Method used


Image

  • Determining Perforation Tunnel Impairment Productivity Using Computed Tomography
  • Determining Perforation Tunnel Impairment Productivity Using Computed Tomography
  • Determining Perforation Tunnel Impairment Productivity Using Computed Tomography

Examples


Embodiment Construction

[0023]While the making and using of various embodiments of the present invention are discussed in detail below, it should be appreciated that the present invention provides many applicable inventive concepts which can be embodied in a wide variety of specific contexts. The specific embodiments discussed herein are merely illustrative of specific ways to make and use the invention, and do not delimit the scope of the invention.

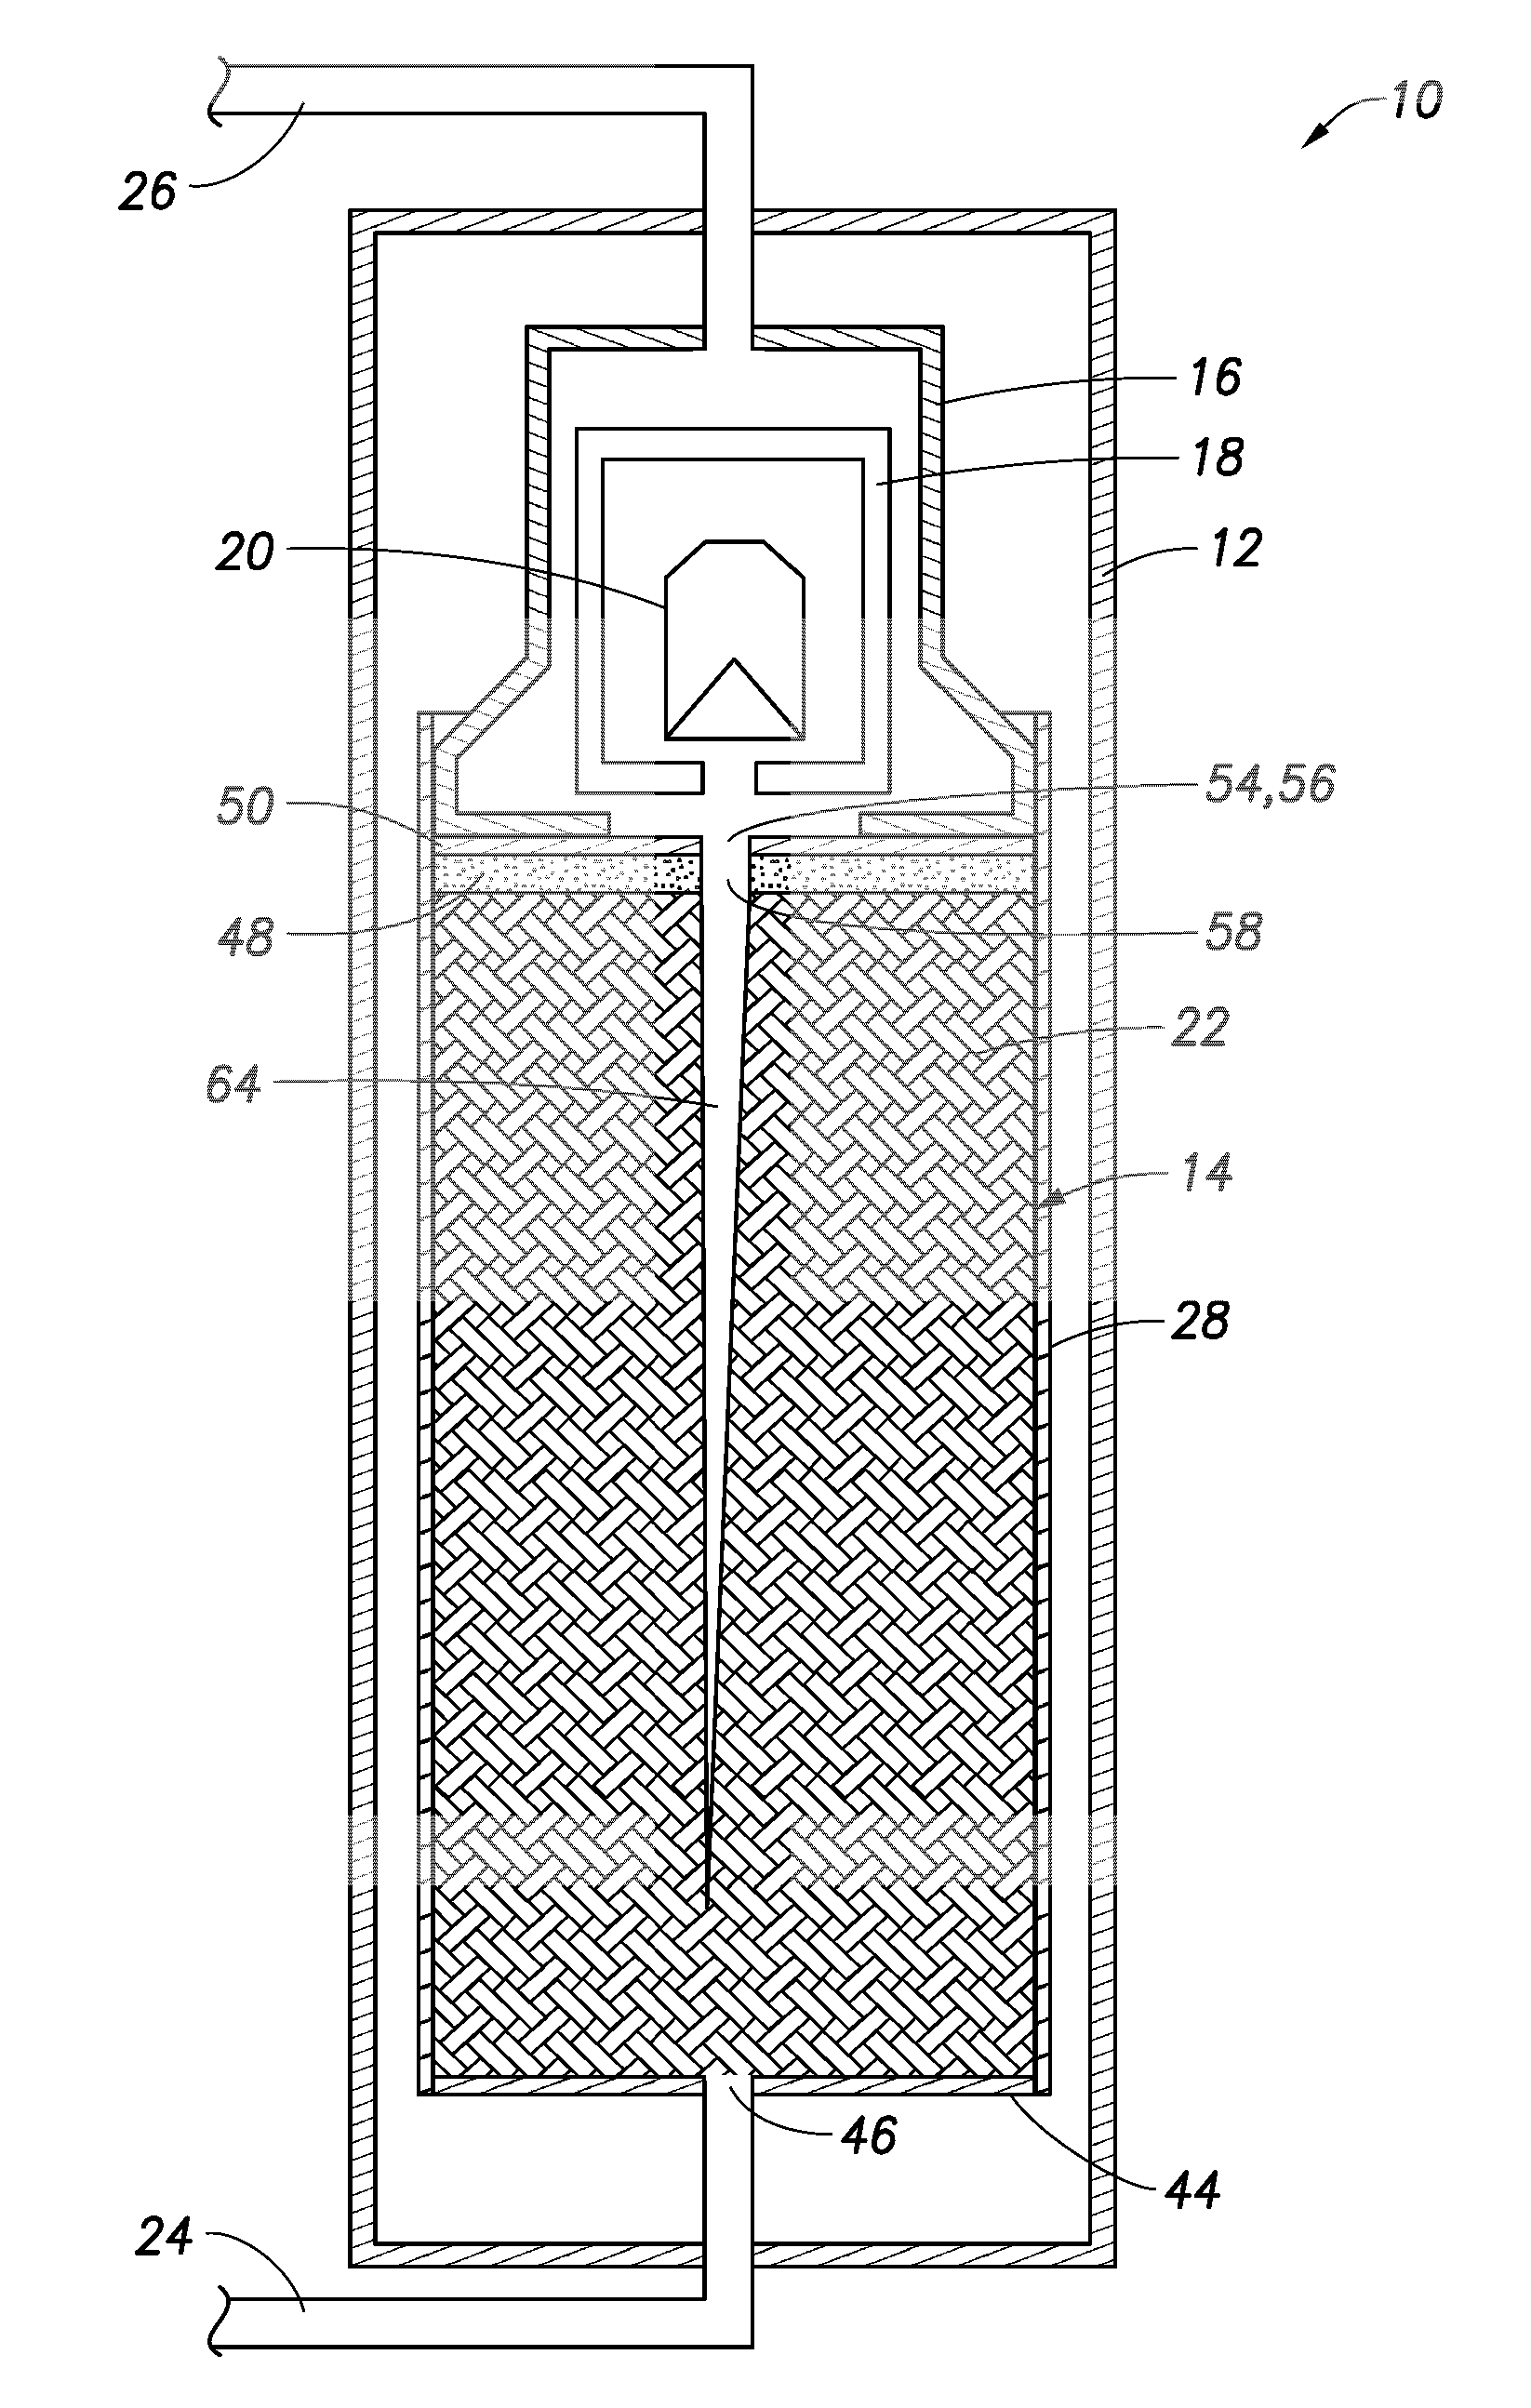
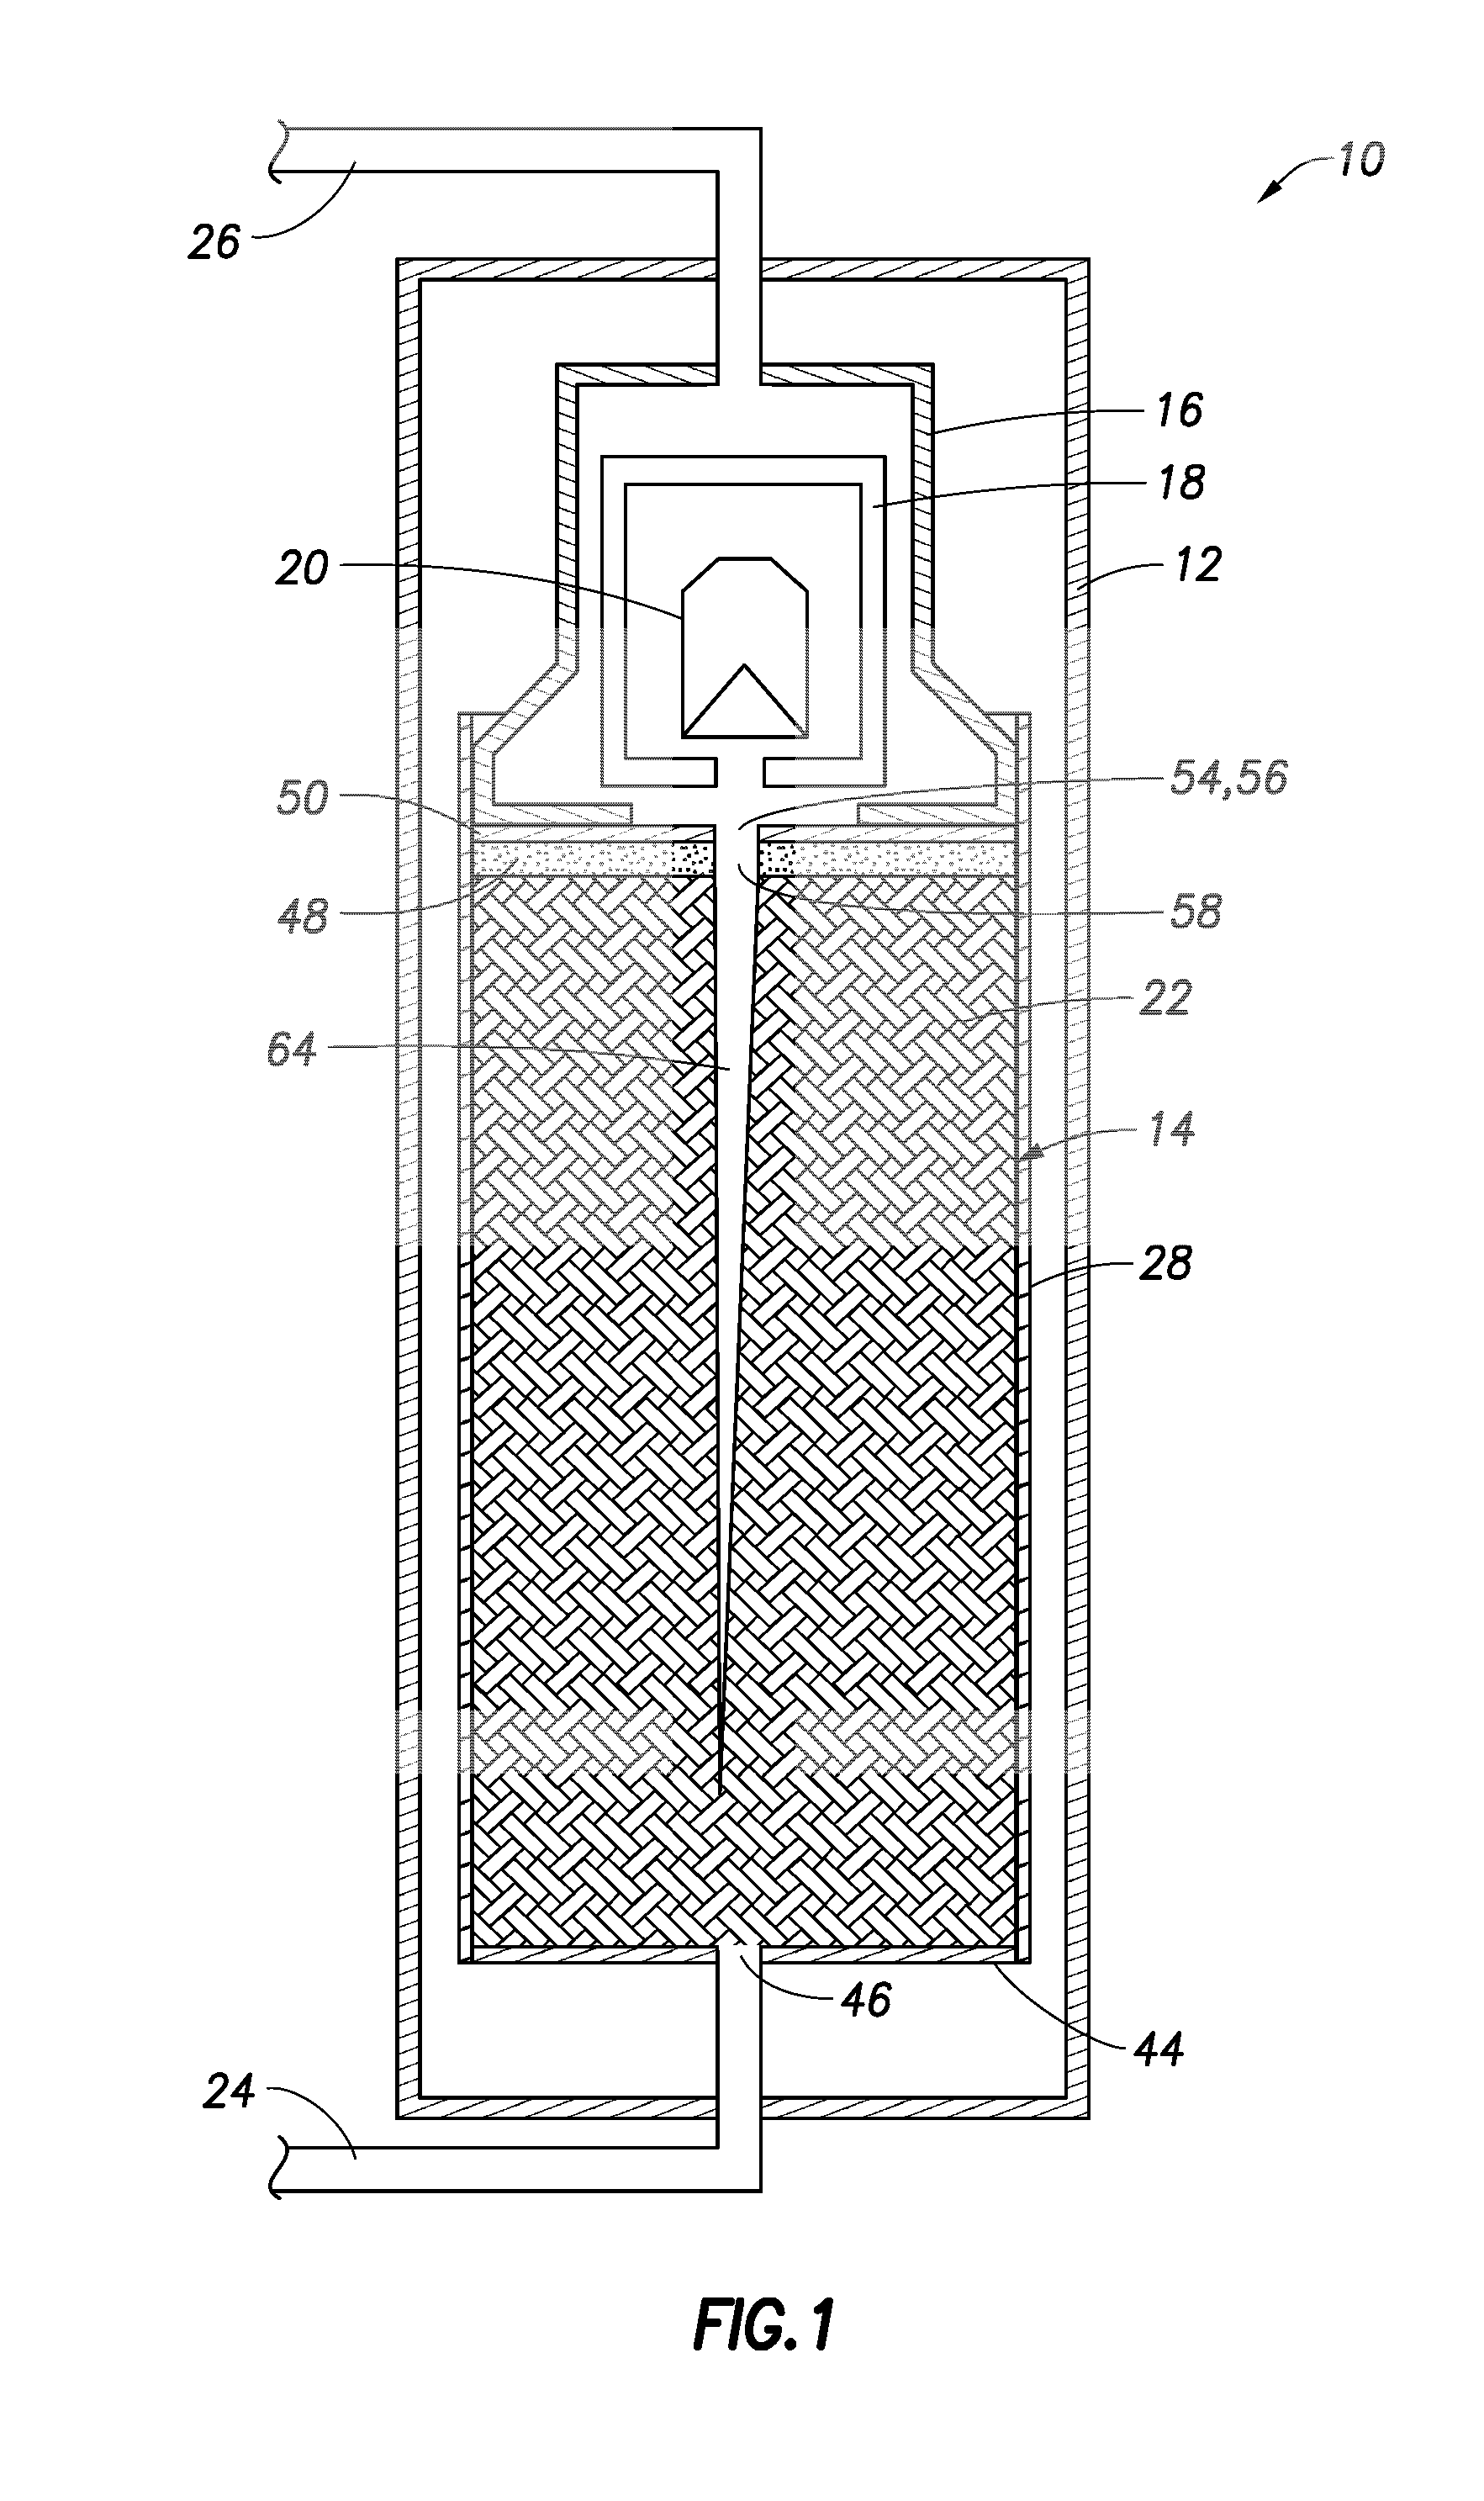
[0024]Referring more particularly to the drawings, wherein like reference characters are used throughout the various figures to refer to like or corresponding parts, there is shown in FIG. 1 one embodiment of the testing apparatus 10 for practicing the methods of the present invention. Apparatus 10 includes a pressure vessel 12 that is operable to be pressurized to a desired elevated pressure up to about 12,000 psi to provide a confining pressure on the target assembly 14. This pressure is used to simulate subterranean wellbore conditions. It will be understood...


PUM

PropertyMeasurementUnit
diameteraaaaaaaaaa
pressureaaaaaaaaaa
pressureaaaaaaaaaa

Abstract

Disclosed is a method of testing the effectiveness of perforations and well treatments to enhance production, wherein tomographic image data is collected while fluid flow tests are conducted on a formation sample and thereafter three dimensional images are created and analyzed.

Description

CROSS REFERENCE TO RELATED APPLICATIONS[0001]NoneBACKGROUND[0002]1. Technical Field[0003]The invention relates generally to the field of estimating the effectiveness of shaped perforation charges. Included is a method for determining effects on fluid flow of perforating charge on a formation sample. The method includes obtaining or constructing an actual or representative sample (consolidated or unconsolidated material) of the subterranean formation and while subjecting the sample to wellbore pressure conditions using an explosive charge to form a perforation tunnel in the formation sample. Tomographic images of the structure of the perforation tunnel and the damaged or disturbed zones of the crush zone around the perforation tunnel are obtained and analyzed. The perforated sample is then subjected to fluid flow while obtaining tomographic images of the fluid flow in the sample. The tomographic images are used to construct three dimensional images of the sample and flow. At least on...

Claims


Application Information

Patent Timeline
Patent Type & Authority Applications(United States)
IPC IPC(8): G01N23/12G01N23/04
CPCG01N23/046G01N23/12G01N23/04E21B49/00G01N2223/311G01N2223/616G01N2223/649E21B43/119G01N23/083
Inventor HAGGERTY, DENNIS J.
Owner HALLIBURTON ENERGY SERVICES INC
Why Eureka
Try Eureka