Efficient evaluation of network robustness with a graph

a graph and network technology, applied in the field of network robustness evaluation, can solve the problems of time and resource consumption, disruption of electricity supply networks, and inability to perform simulations on a large network, so as to reduce the scope of simulations and alleviate the impact of system level

Inactive Publication Date: 2013-12-19
IBM CORP
View PDF23 Cites 1 Cited by
  • Summary
  • Abstract
  • Description
  • Claims
  • Application Information

AI Technical Summary

Problems solved by technology

Due to the increasing frequency of adverse weather events, cities have to deal with emergency situations during which certain areas may experience difficult road conditions or be rendered completely inaccessible.
Further, supply chain network of a distributor or an assembly line of a product that requires many components are vulnerable to disruptions.
In addition, electricity supply network can be disrupted by anticipated or unanticipated natural disasters.
Performing simulations on a large network, however, can be both time and resource consuming as the network often comprises a large mathematical graph (“graph” hereafter) with more than tens of thousands of nodes and edges.
As the number of n increases, the number of disconnections can easily become an astronomical number that even modern computers cannot handle.

Method used


Image

  • Efficient evaluation of network robustness with a graph
  • Efficient evaluation of network robustness with a graph
  • Efficient evaluation of network robustness with a graph

Examples


Embodiment Construction

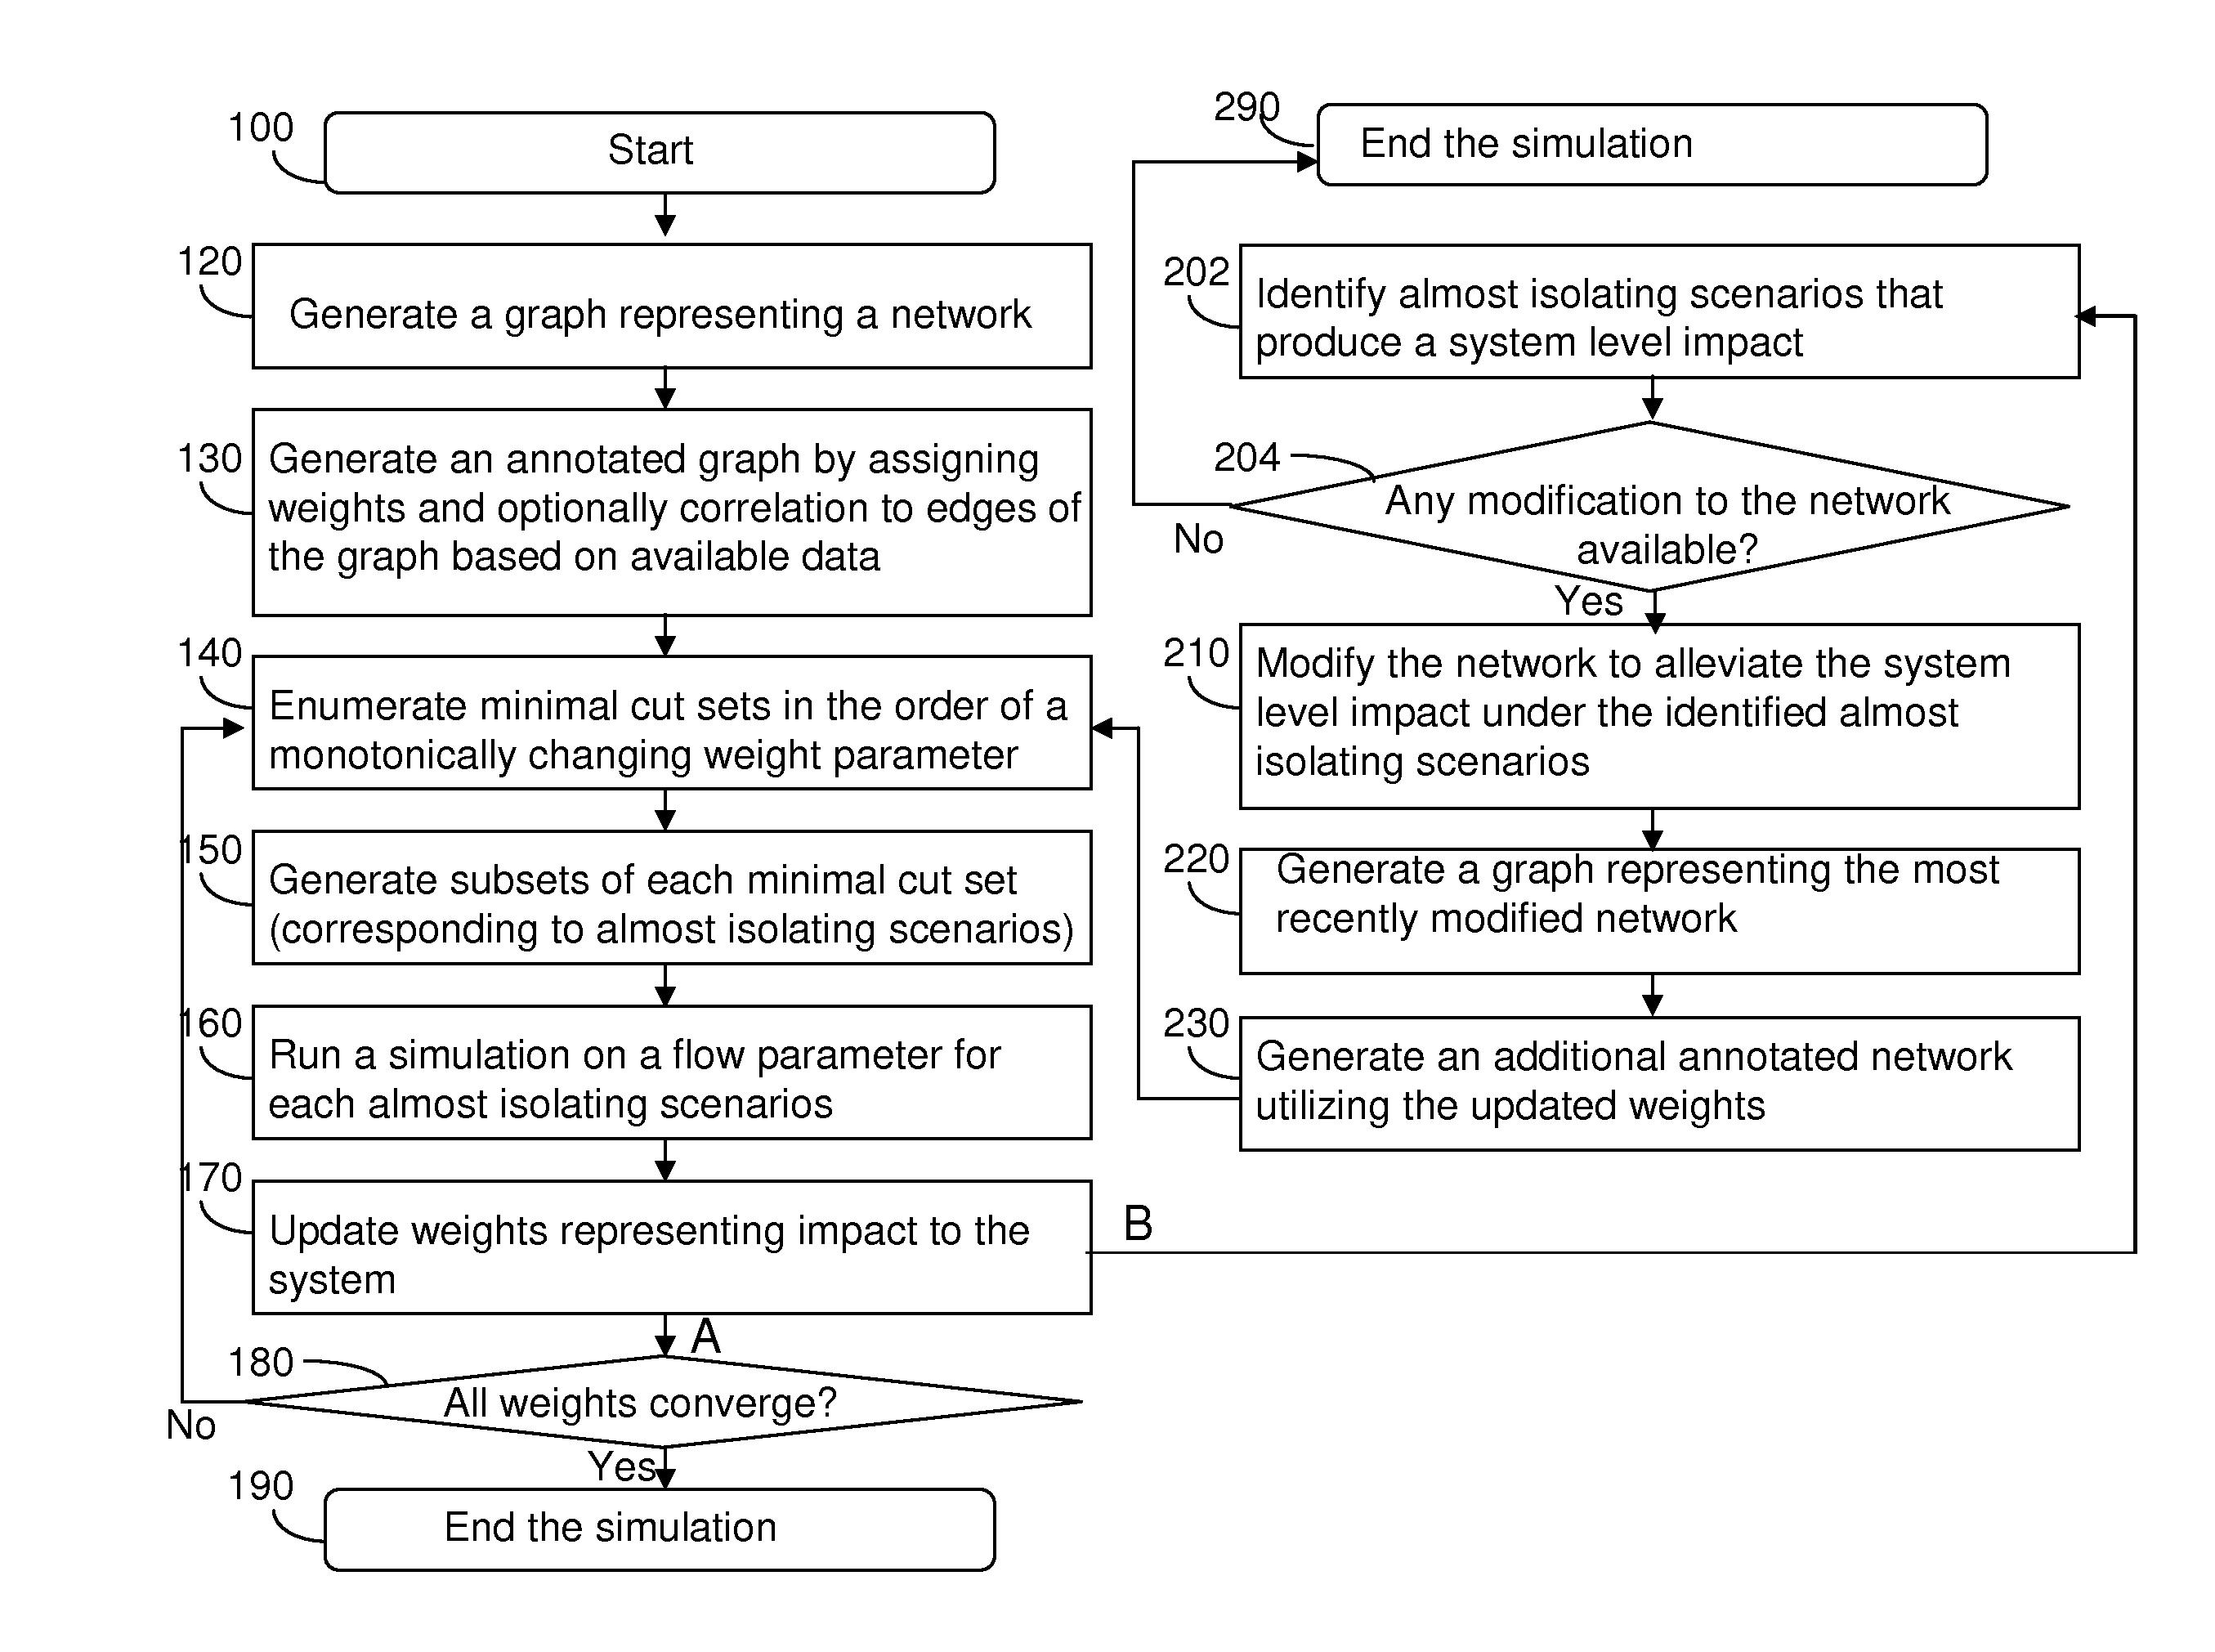
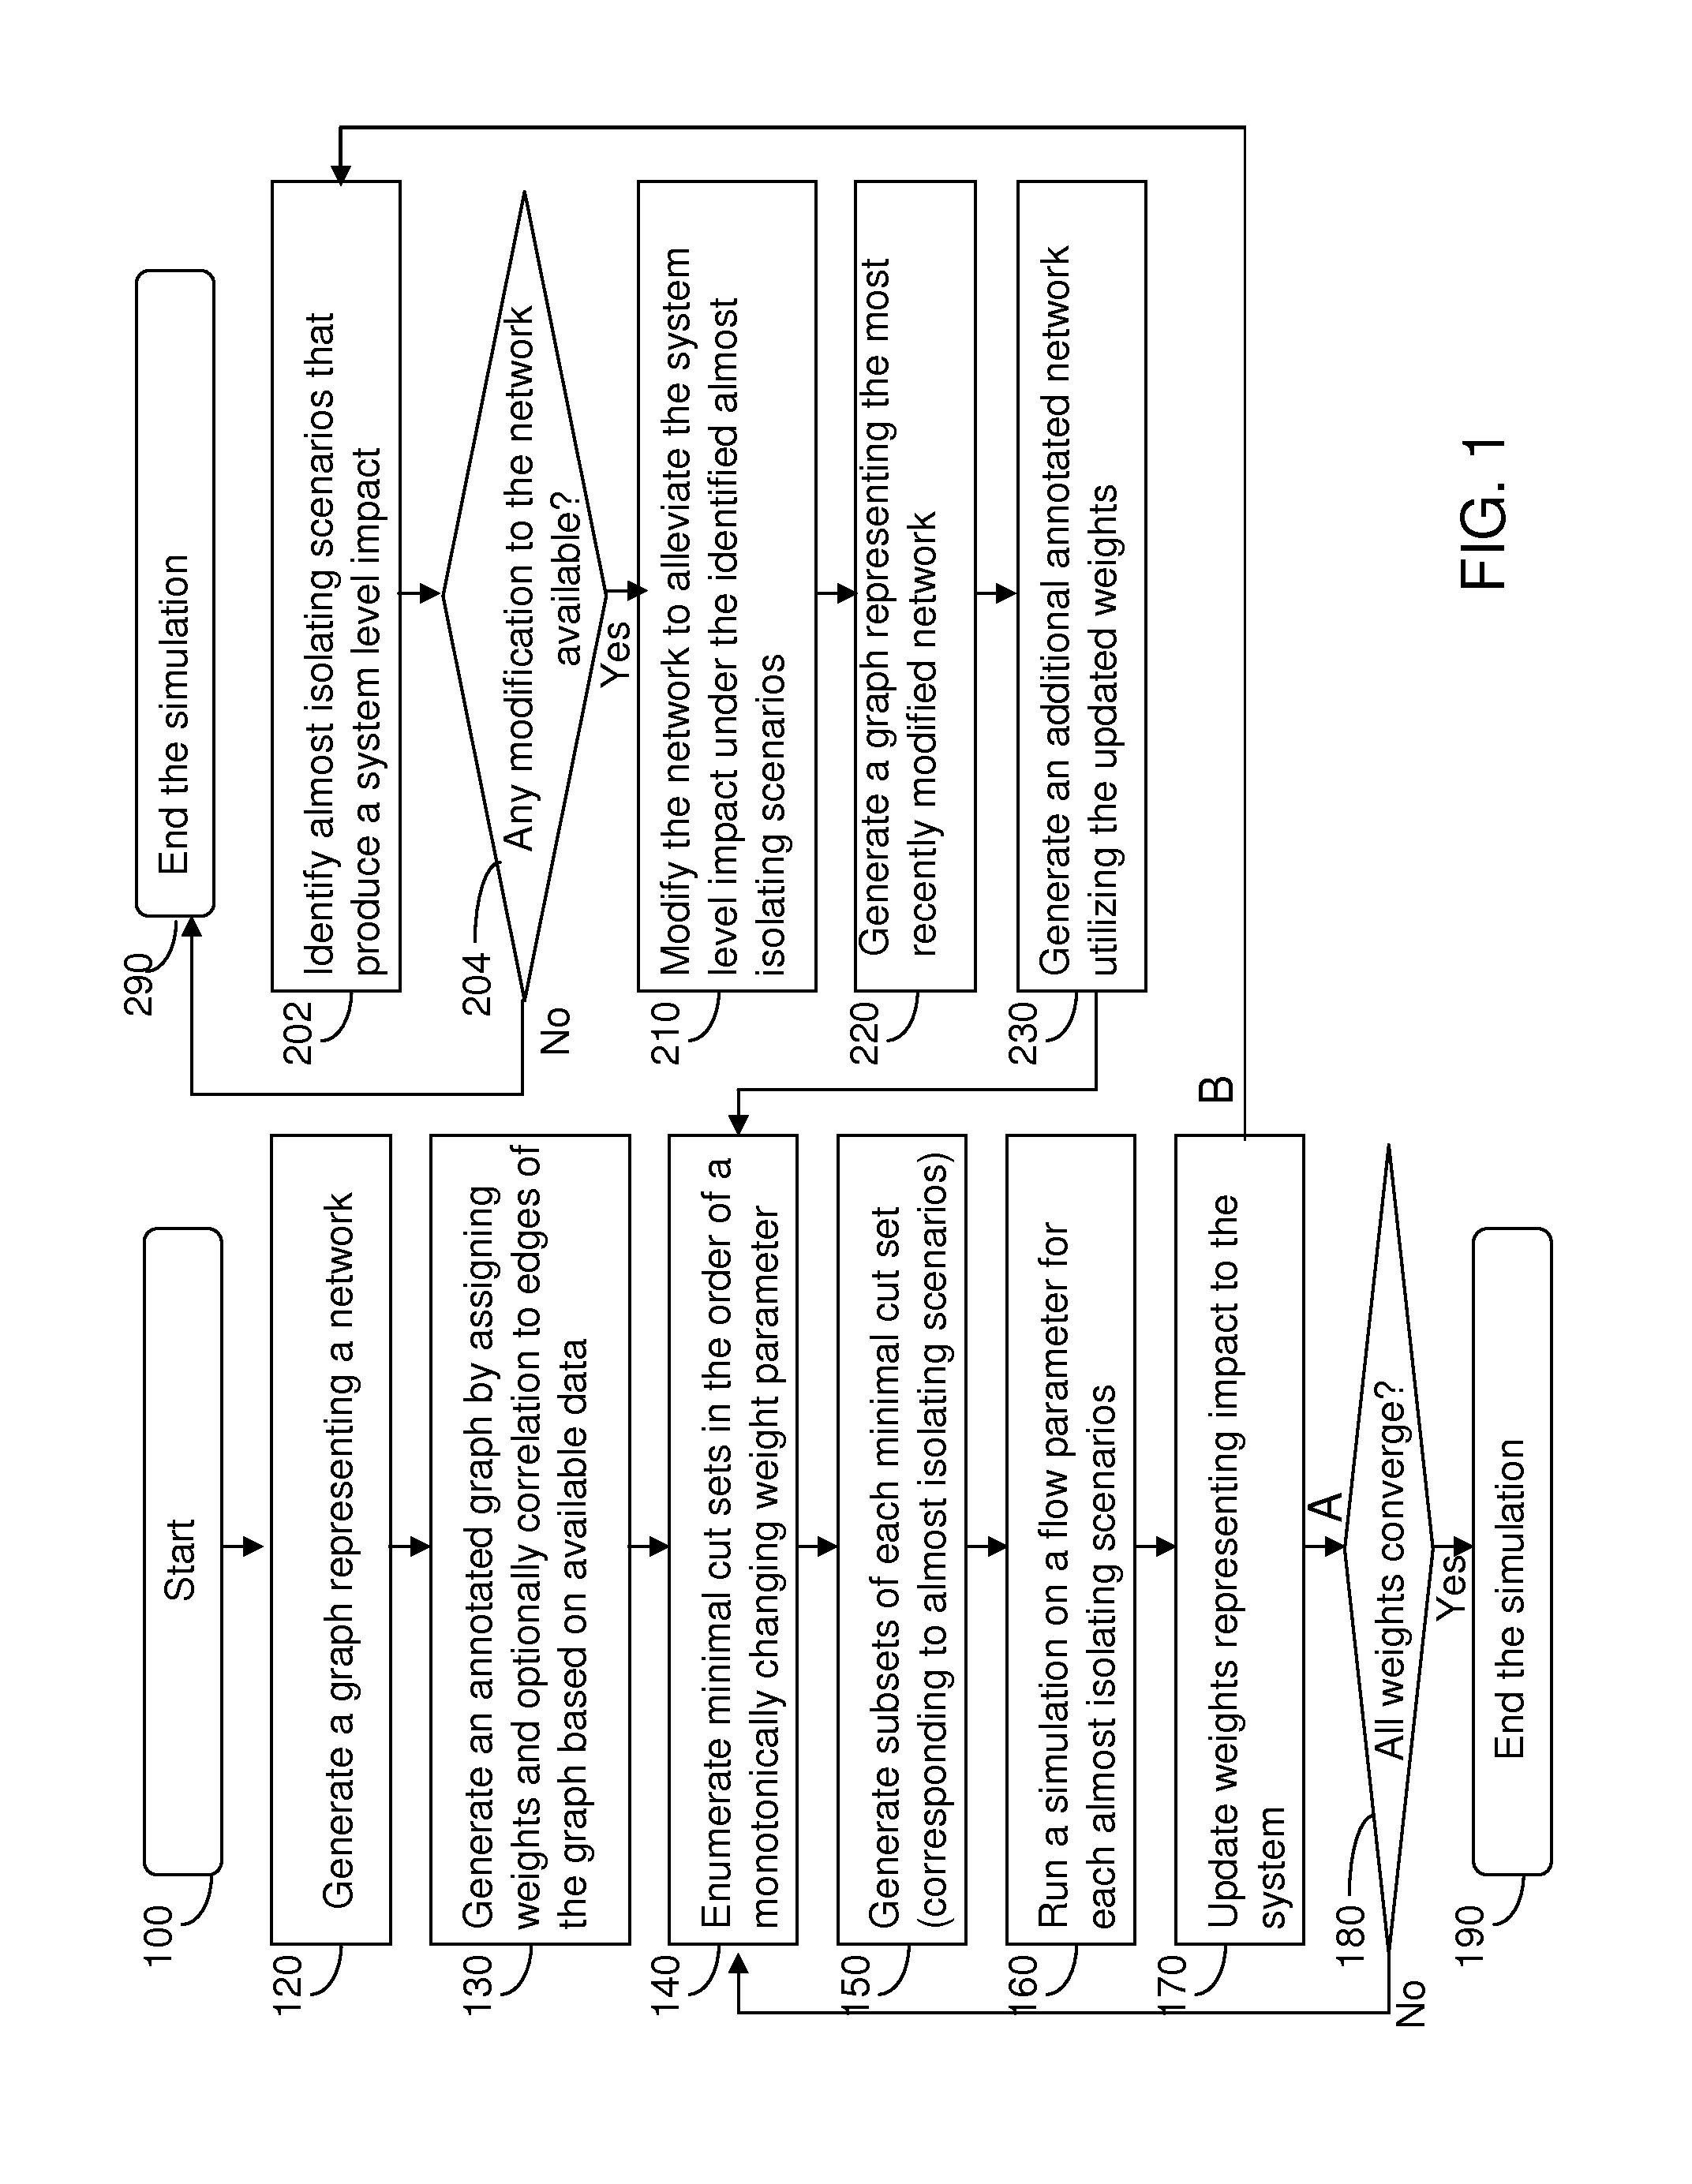
[0014]As stated above, the present disclosure relates to a methodology for evaluating a network for robustness employing a graph and a system for implementing the same, which are now described in detail with accompanying figures. The drawings are not necessarily drawn to scale.

[0015]As used herein, a “flow parameter” refers to a parameter that measures the functionality of a network. For example, a traffic network can have a flow parameter representing the flow of the traffic. A supply network can have a flow parameter representing the flow (transportation) of goods. An electricity network can have a flow parameter representing the amount of power transmission. It is noted that a network can be characterized by more than one flow parameter. For example, a traffic network can be represented by the traffic flows of different types of vehicles, and the supply network can be represented by the flows of different types of goods (grains, minerals, etc.).

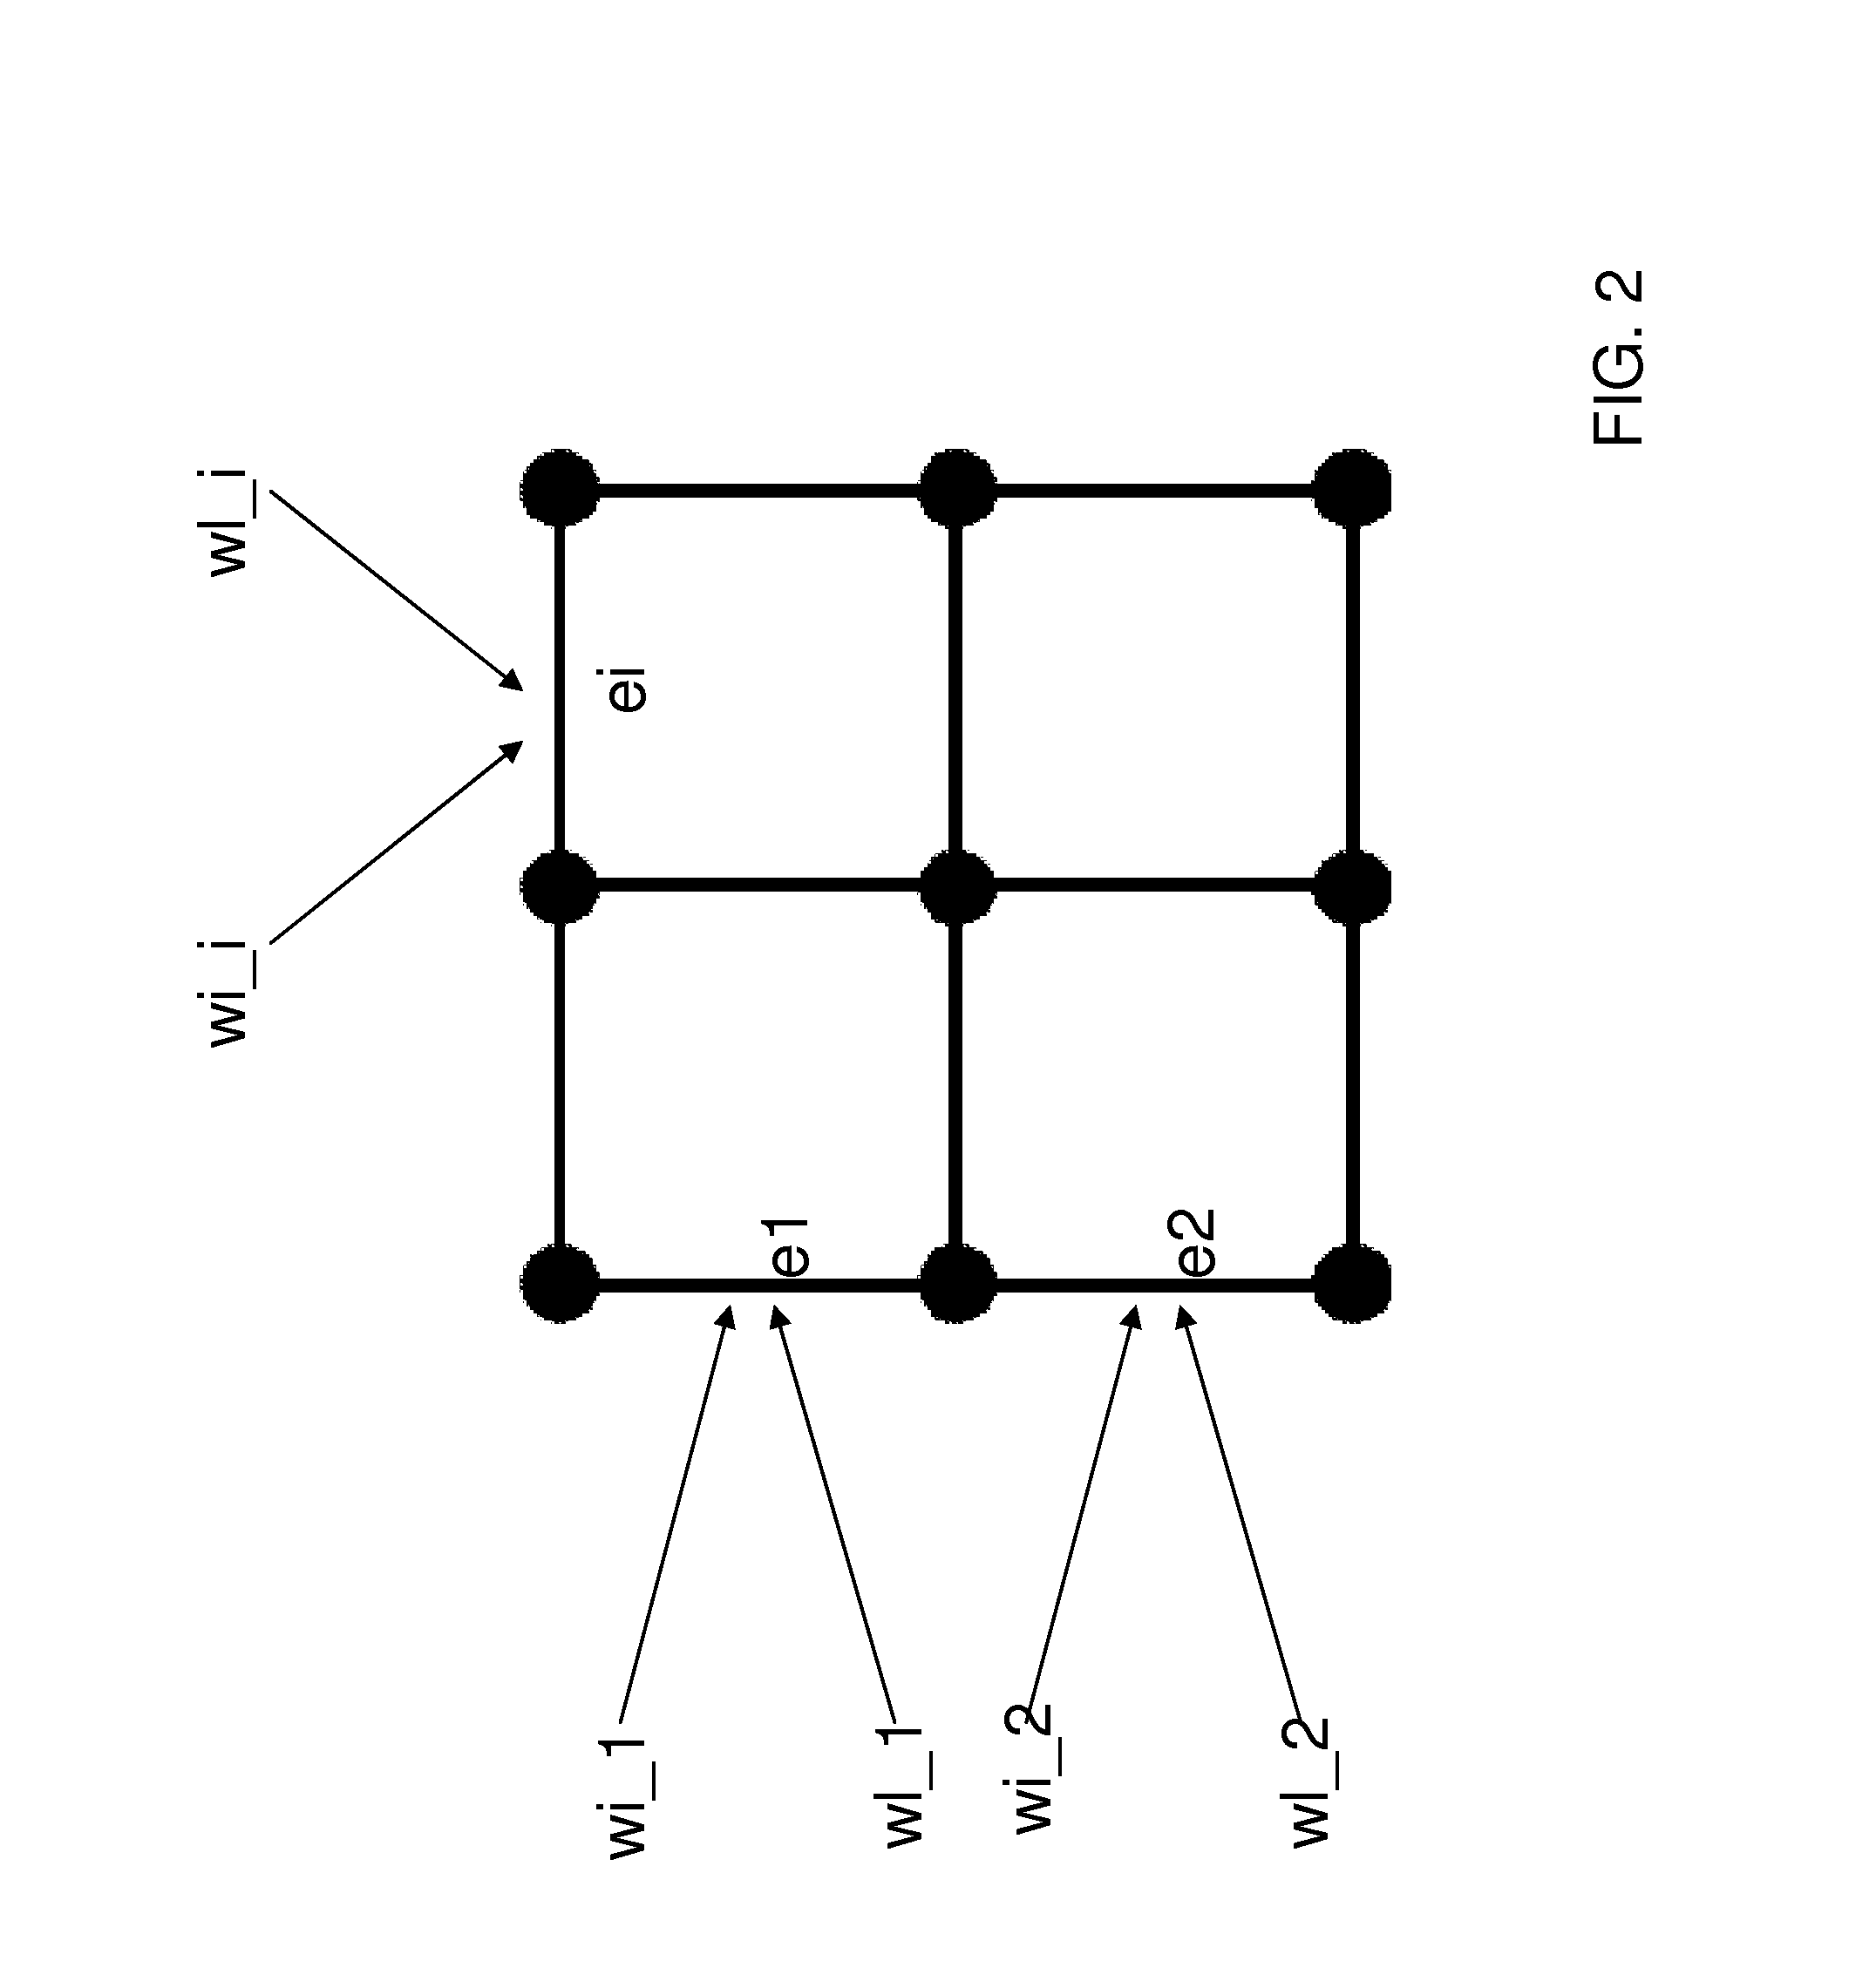
[0016]As used herein, a “graph” is ...


PUM


Abstract

Likely disconnections or system-level-impact producing slowdown in a flow parameter in a network can be identified by annotating a graph representing the network with a weight to edges of a graph representing the network. The weight can be linearly or non-linearly proportional to the inverse of the severity of the impact, and / or linearly or non-linearly proportional to the inverse of the likelihood of disconnection. Minimal cut sets needed to generate a disconnection in the network are identified from the annotated network based on the weights on the edges. Subsets of each minimal cut set are generated and evaluated during a simulation. The subsets can correspond to almost isolated scenarios for the network. The scope of the simulations can be reduced by selecting the minimal cut sets employing the weight.

Description

BACKGROUND[0001]The present disclosure relates to a methodology for evaluating a network for robustness employing a graph and a system for implementing the same.[0002]The ability to monitor, model, and simulate flow parameters on a network is vital in planning, constructing, and maintaining the network in a condition that is robust enough to withstand disruptive events. The ability to monitor, model and simulate traffic conditions on roads of large cities and metropolitan areas has become increasingly essential for transportation agencies and other organizations involved in providing services to citizens (such as the police, fire departments or time-sensitive delivery companies) and planning more robust infrastructure in the path towards smarter cities. Due to the increasing frequency of adverse weather events, cities have to deal with emergency situations during which certain areas may experience difficult road conditions or be rendered completely inaccessible. Identifying the poss...

Claims


Application Information

Patent Timeline
Patent Type & Authority Applications(United States)
IPC IPC(8): G06F17/50
CPCG06F30/18G06F30/13G06F30/20G06F30/23G06F2113/08G06F30/367
Inventor DIAS DE ASSUNCAO, MARCOSFLACH, BRUNO D.DE C. GATTI, MAIRA A.HARRY PUTRA, RUDY R.IMAMICHI, TAKASHISTELMAR NETTO, MARCO AURELIO
Owner IBM CORP
Why Eureka
Try Eureka