
System and Method for Estimating Spatially Varying Defocus Blur in a Digital Image

a digital image and spatially variable technology, applied in image enhancement, image analysis, instruments, etc., can solve the problems of blur assumption, defocus blur, limited depth of field of digital imaging system, etc., and achieve the effect of reducing the computational cost of a given blur estimation exercis

Active Publication Date: 2013-03-21
ADOBE INC
View PDF2 Cites 47 Cited by
  • Summary
  • Abstract
  • Description
  • Claims
  • Application Information

AI Technical Summary

Benefits of technology

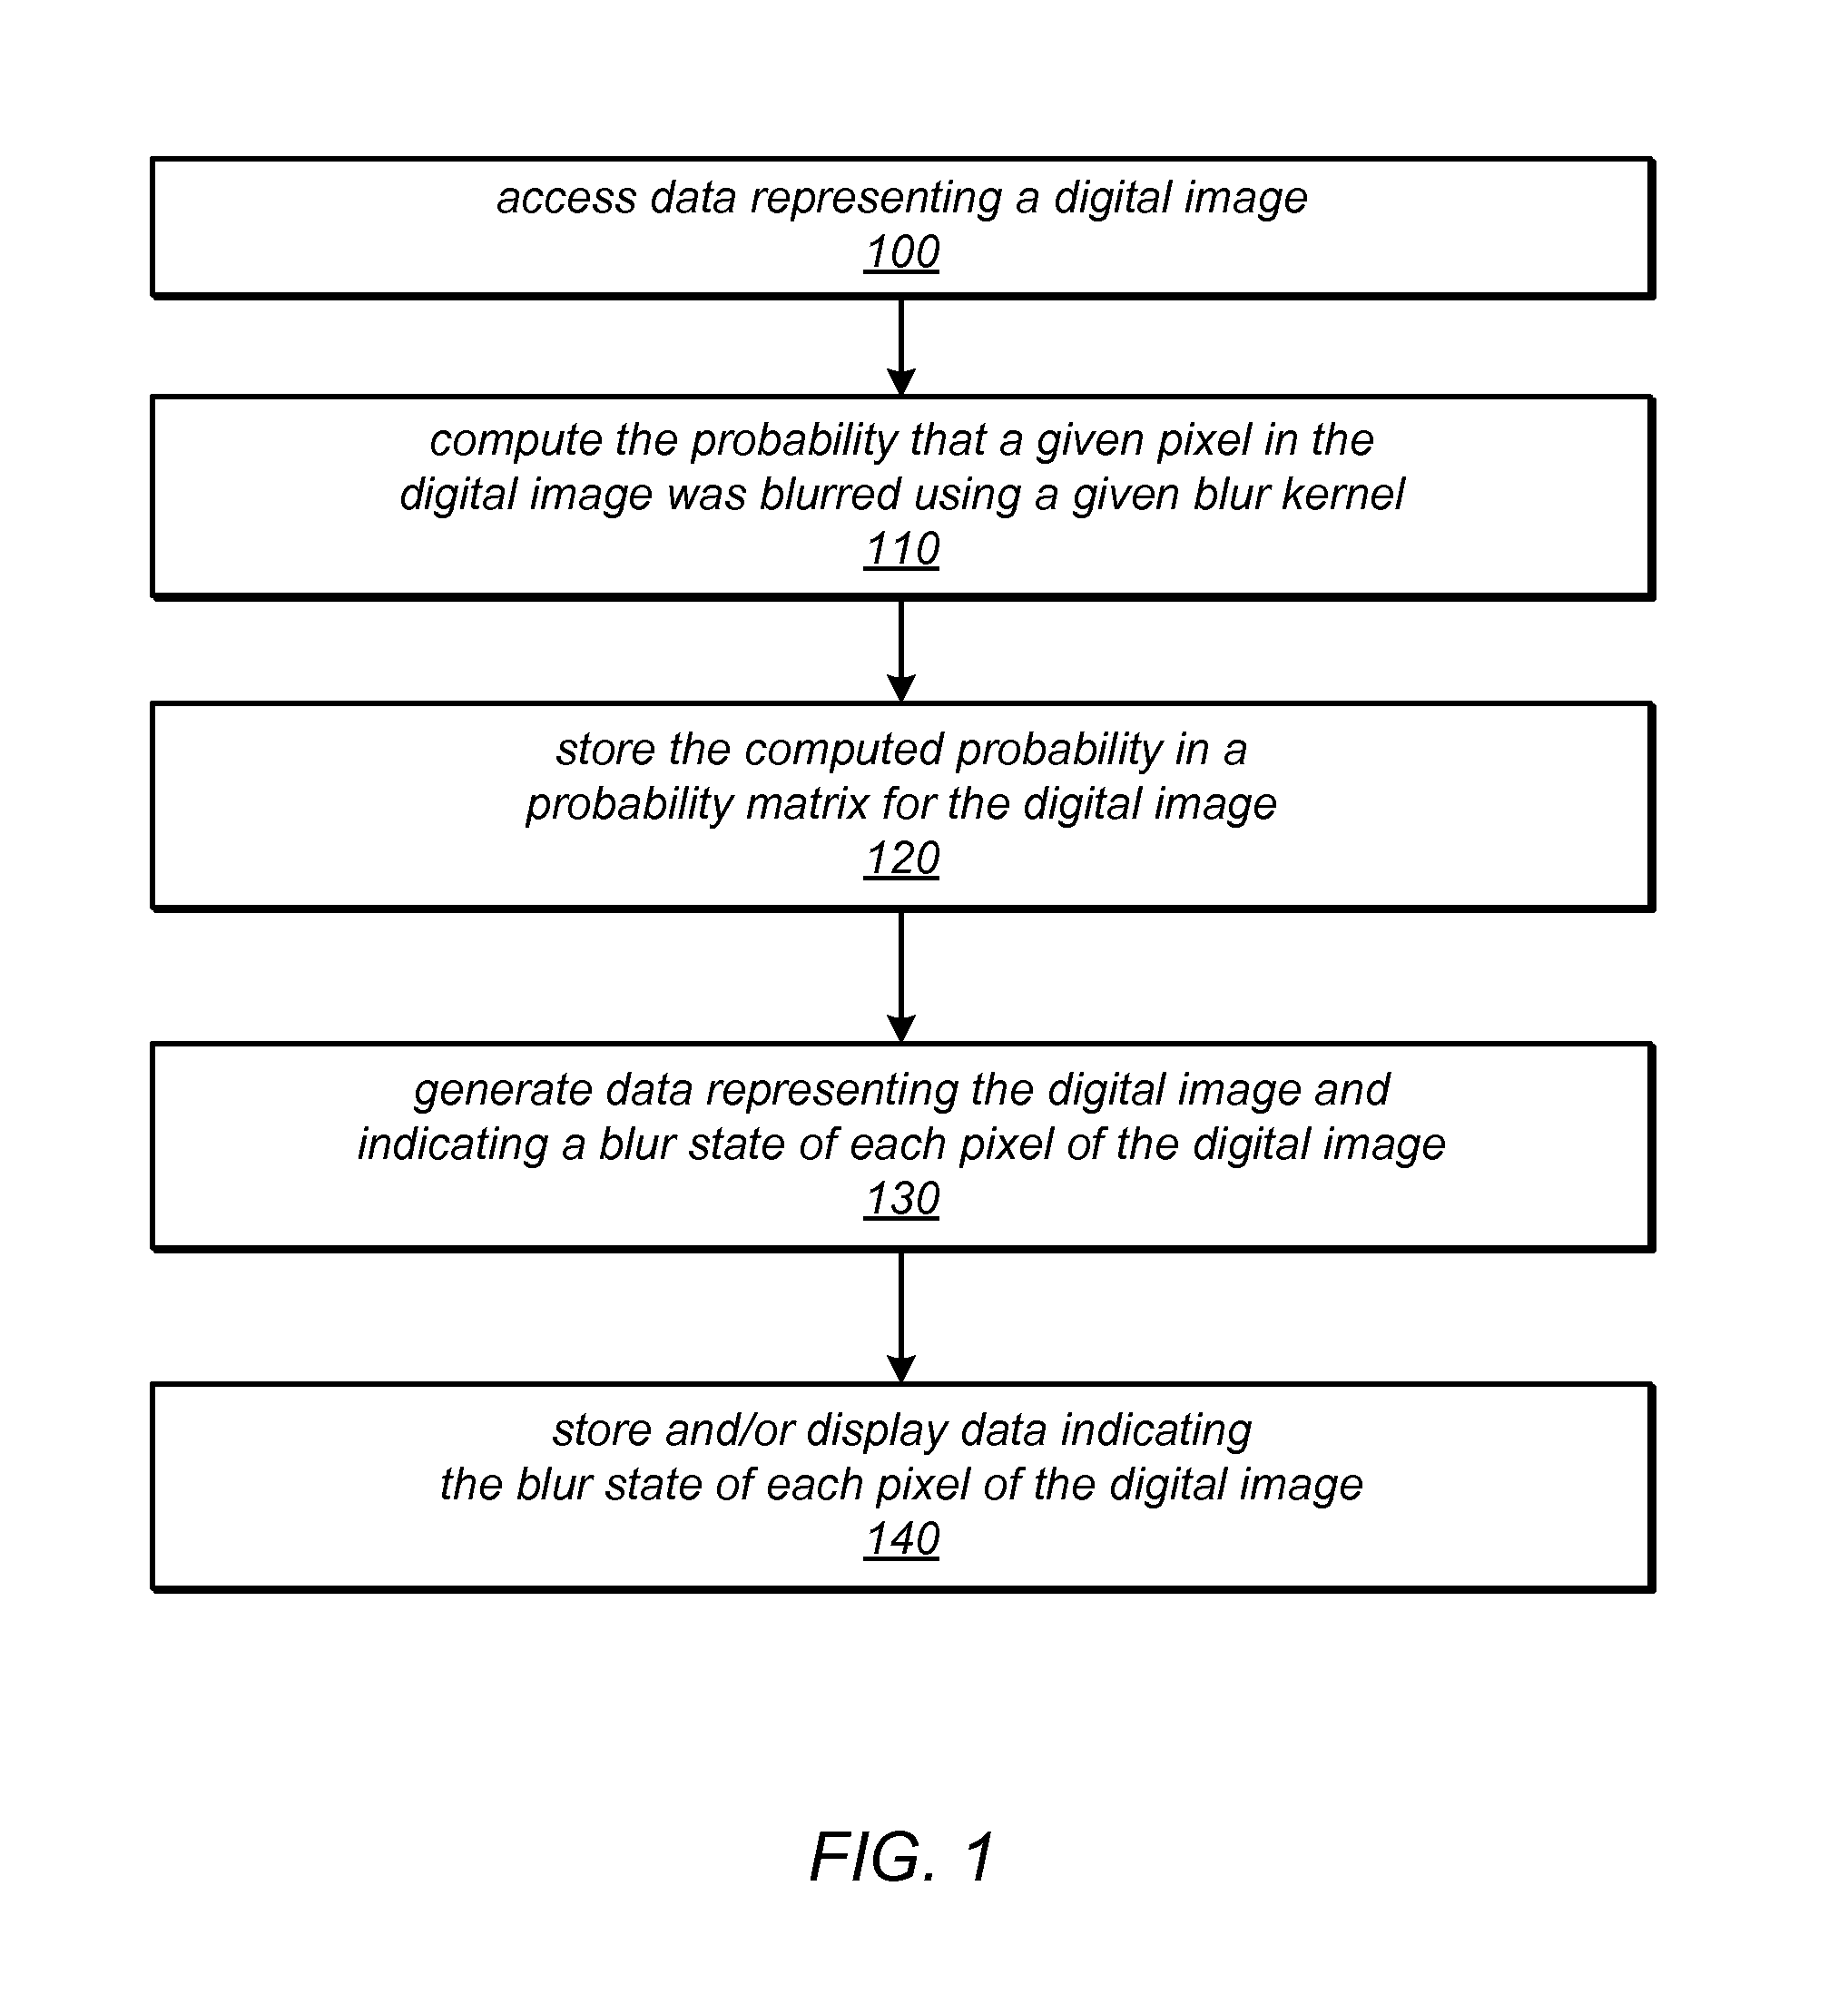
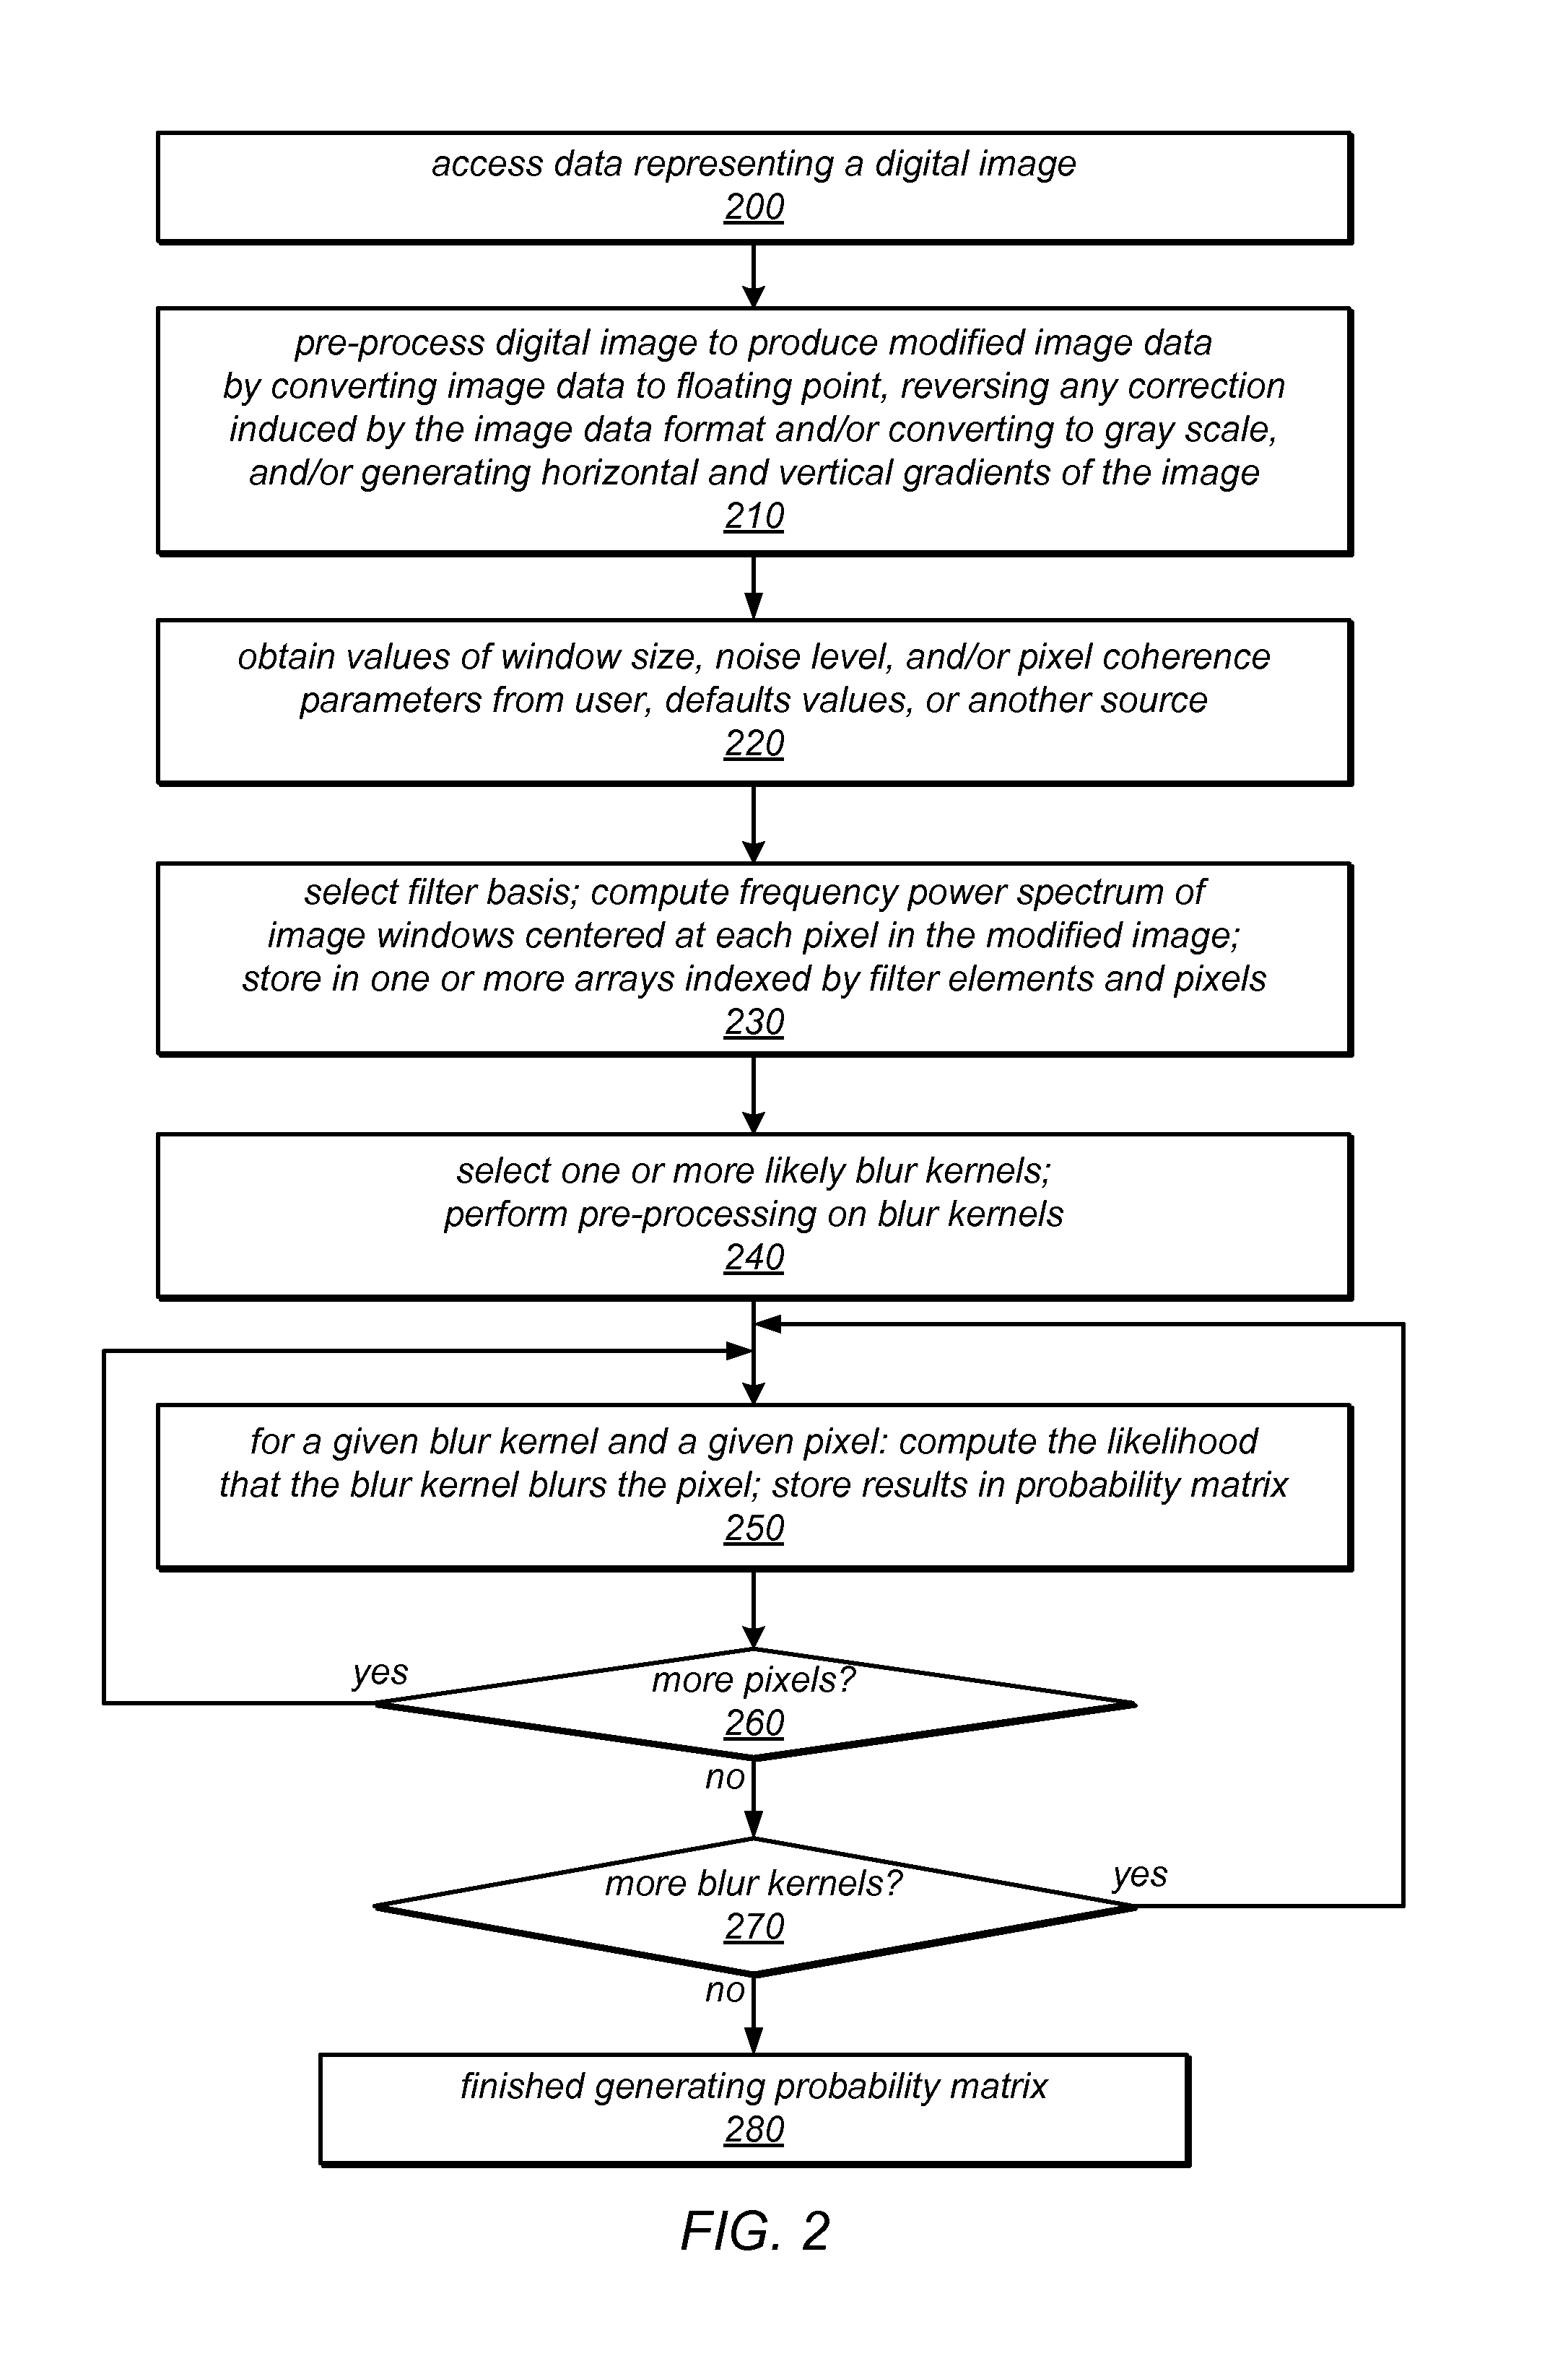
The patent describes a method to classify the blur in a digital image using a blur classification module. This module generates probability values for different blur kernels and computes a frequency power spectrum for pixels and blur kernels. The spectrum is then fitted using a polynomial-based function, and the fitted values are stored in a set of look-up tables. These tables are used to optimize the likelihood of the blur estimation. The method also involves generating a preliminary mapping between pixels and a set of possible blur states, and then minimizing an energy function to generate a final estimated output blur map. The method can also perform binary segmentation of the image based on the likelihood of blur. The technical effects of this patent are improved accuracy and efficiency in blur classification and estimation with reduced computational costs.

Problems solved by technology

A digital imaging system has a limited depth of field, which leads to defocus blur.
One problem with this approach is that blur is assumed to arise from a Gaussian blur kernel, which is not an accurate model of the physical process involved.
Also, in observed results, the content of the image tends to unduly affect the blur estimate.
However, this method is limited to one-dimensional (1D) blur kernels.
It also uses a sharp edged window, which makes it impossible to distinguish the sharp edge of the window from sharp edges in the image.
In addition, the segmentation generated with this method can only distinguish between part of the image blurred with one blur kernel and those parts of the image that are not blurred with this one kernel.

Method used


Image

  • System and Method for Estimating Spatially Varying Defocus Blur in a Digital Image
  • System and Method for Estimating Spatially Varying Defocus Blur in a Digital Image
  • System and Method for Estimating Spatially Varying Defocus Blur in a Digital Image

Examples


experimental examples

[0213]Two experiments that employ the systems and techniques described herein for blur map generation involving simulated images and one experiment involving a real image are illustrated in FIGS. 14A-14D, 15A-15D, and 16A-16B. In each of these experiments, the illustrated blur maps represent different blur kernel radius values using different colors, according to a corresponding blur map legend. In these examples, each of the blur map legends maps different colors to radius values in the range [0,8]. In the first experiment, FIG. 14A illustrates a simulated input image 1400 that includes an in-focus subject and out-of-focus background. More specifically, the portion of the image inside the square in the center of input image 1400 is completely un-blurred, and the background of input image 1400 has been blurred by a disc kernel having a radius r=5. In this example, input image 1400 was generated by superimposing a small, sharp image over larger image that was blurred. In this example...

example implementations

[0222]FIG. 17 is a block diagram illustrating various modules that may implement the blur state classification and / or coherent blur map generation techniques described herein, according to some embodiments. For example, FIG. 17 illustrates a blur classification module 1720 that may implement one or more of the image editing techniques and tools described herein. Module 1720 may, for example, implement one or more of: input image pre-processing, image window pre-processing (e.g., computing the power frequency spectrum of image windows), blur kernel pre-processing (e.g., computing the frequency power spectrum for each blur kernel), blur classification probability matrix generation, preliminary blur map estimation, coherent blur map generation, binary segmentation, and / or depth estimation. FIG. 18 illustrates an example computer system on which embodiments of module 1720 may be implemented. Module 1720 may receive as input one or more digital images 1710. Example input images are shown...


PUM


Abstract

An image editing application (or a blur classification module thereof) may automatically estimate a coherent defocus blur map from a single input image. The application may represent the blur spectrum as a differentiable function of radius r, and the optimal radius may be estimated by optimizing the likelihood function through a gradient descent algorithm. The application may generate the spectrum function over r through polynomial-based fitting. After fitting, the application may generate look-up tables to store values for the spectrum and for its first and second order derivatives, respectively. The use of these tables in the likelihood optimization process may significantly reduce the computational costs of a given blur estimation exercise. The application may minimize an energy function that includes a data term, a smoothness term, and a smoothness parameter that is adaptive to local image content. The output blur map may be used for image object depth estimation.

Description

PRIORITY INFORMATION[0001]This application claims benefit of priority of U.S. Provisional Application Ser. No. 61 / 535,822 entitled “System and Method for Estimating Lens Blur in a Digital Image” filed Sep. 16, 2011, the content of which is incorporated by reference herein in its entirety.BACKGROUNDDescription of the Related Art[0002]It is common in a digital photo for the subject of interest to be in focus and for the remaining background, or possibly foreground, to be more or less out of focus. An artist or photo editor will often want to edit the subject of interest in a photo, or the background, separately from the rest of the image. For example, the artist may want to obscure, darken, or lighten the background. Conversely, the artist may want to enhance the contrast or lighting only in the subject of interest.[0003]A digital imaging system has a limited depth of field, which leads to defocus blur. Defocus blur is spatially changing, and can typically be locally described though ...

Claims


Application Information

Patent Timeline
IPC IPC(8): G06K9/34
CPCG06T5/003G06T7/0081G06T2207/20076G06T2207/20064G06T2207/10024G06T7/11G06T5/73
Inventor SCHILLER, STEPEN N.COHEN, SCOTT D.ZHU, XIANG
Owner ADOBE INC
Learn More