
Graph matching system for comparing and merging fault models

a fault model and graph matching technology, applied in the field of graph matching system for comparing and merging fault models, can solve problems such as failures and faults, types of devices and algorithms are susceptible to errors, failures and faults, and affect the operation of the vehicle, and it is difficult to compare and combine them directly

Active Publication Date: 2012-06-14
GM GLOBAL TECH OPERATIONS LLC
View PDF8 Cites 16 Cited by
  • Summary
  • Abstract
  • Description
  • Claims
  • Application Information

AI Technical Summary

Benefits of technology

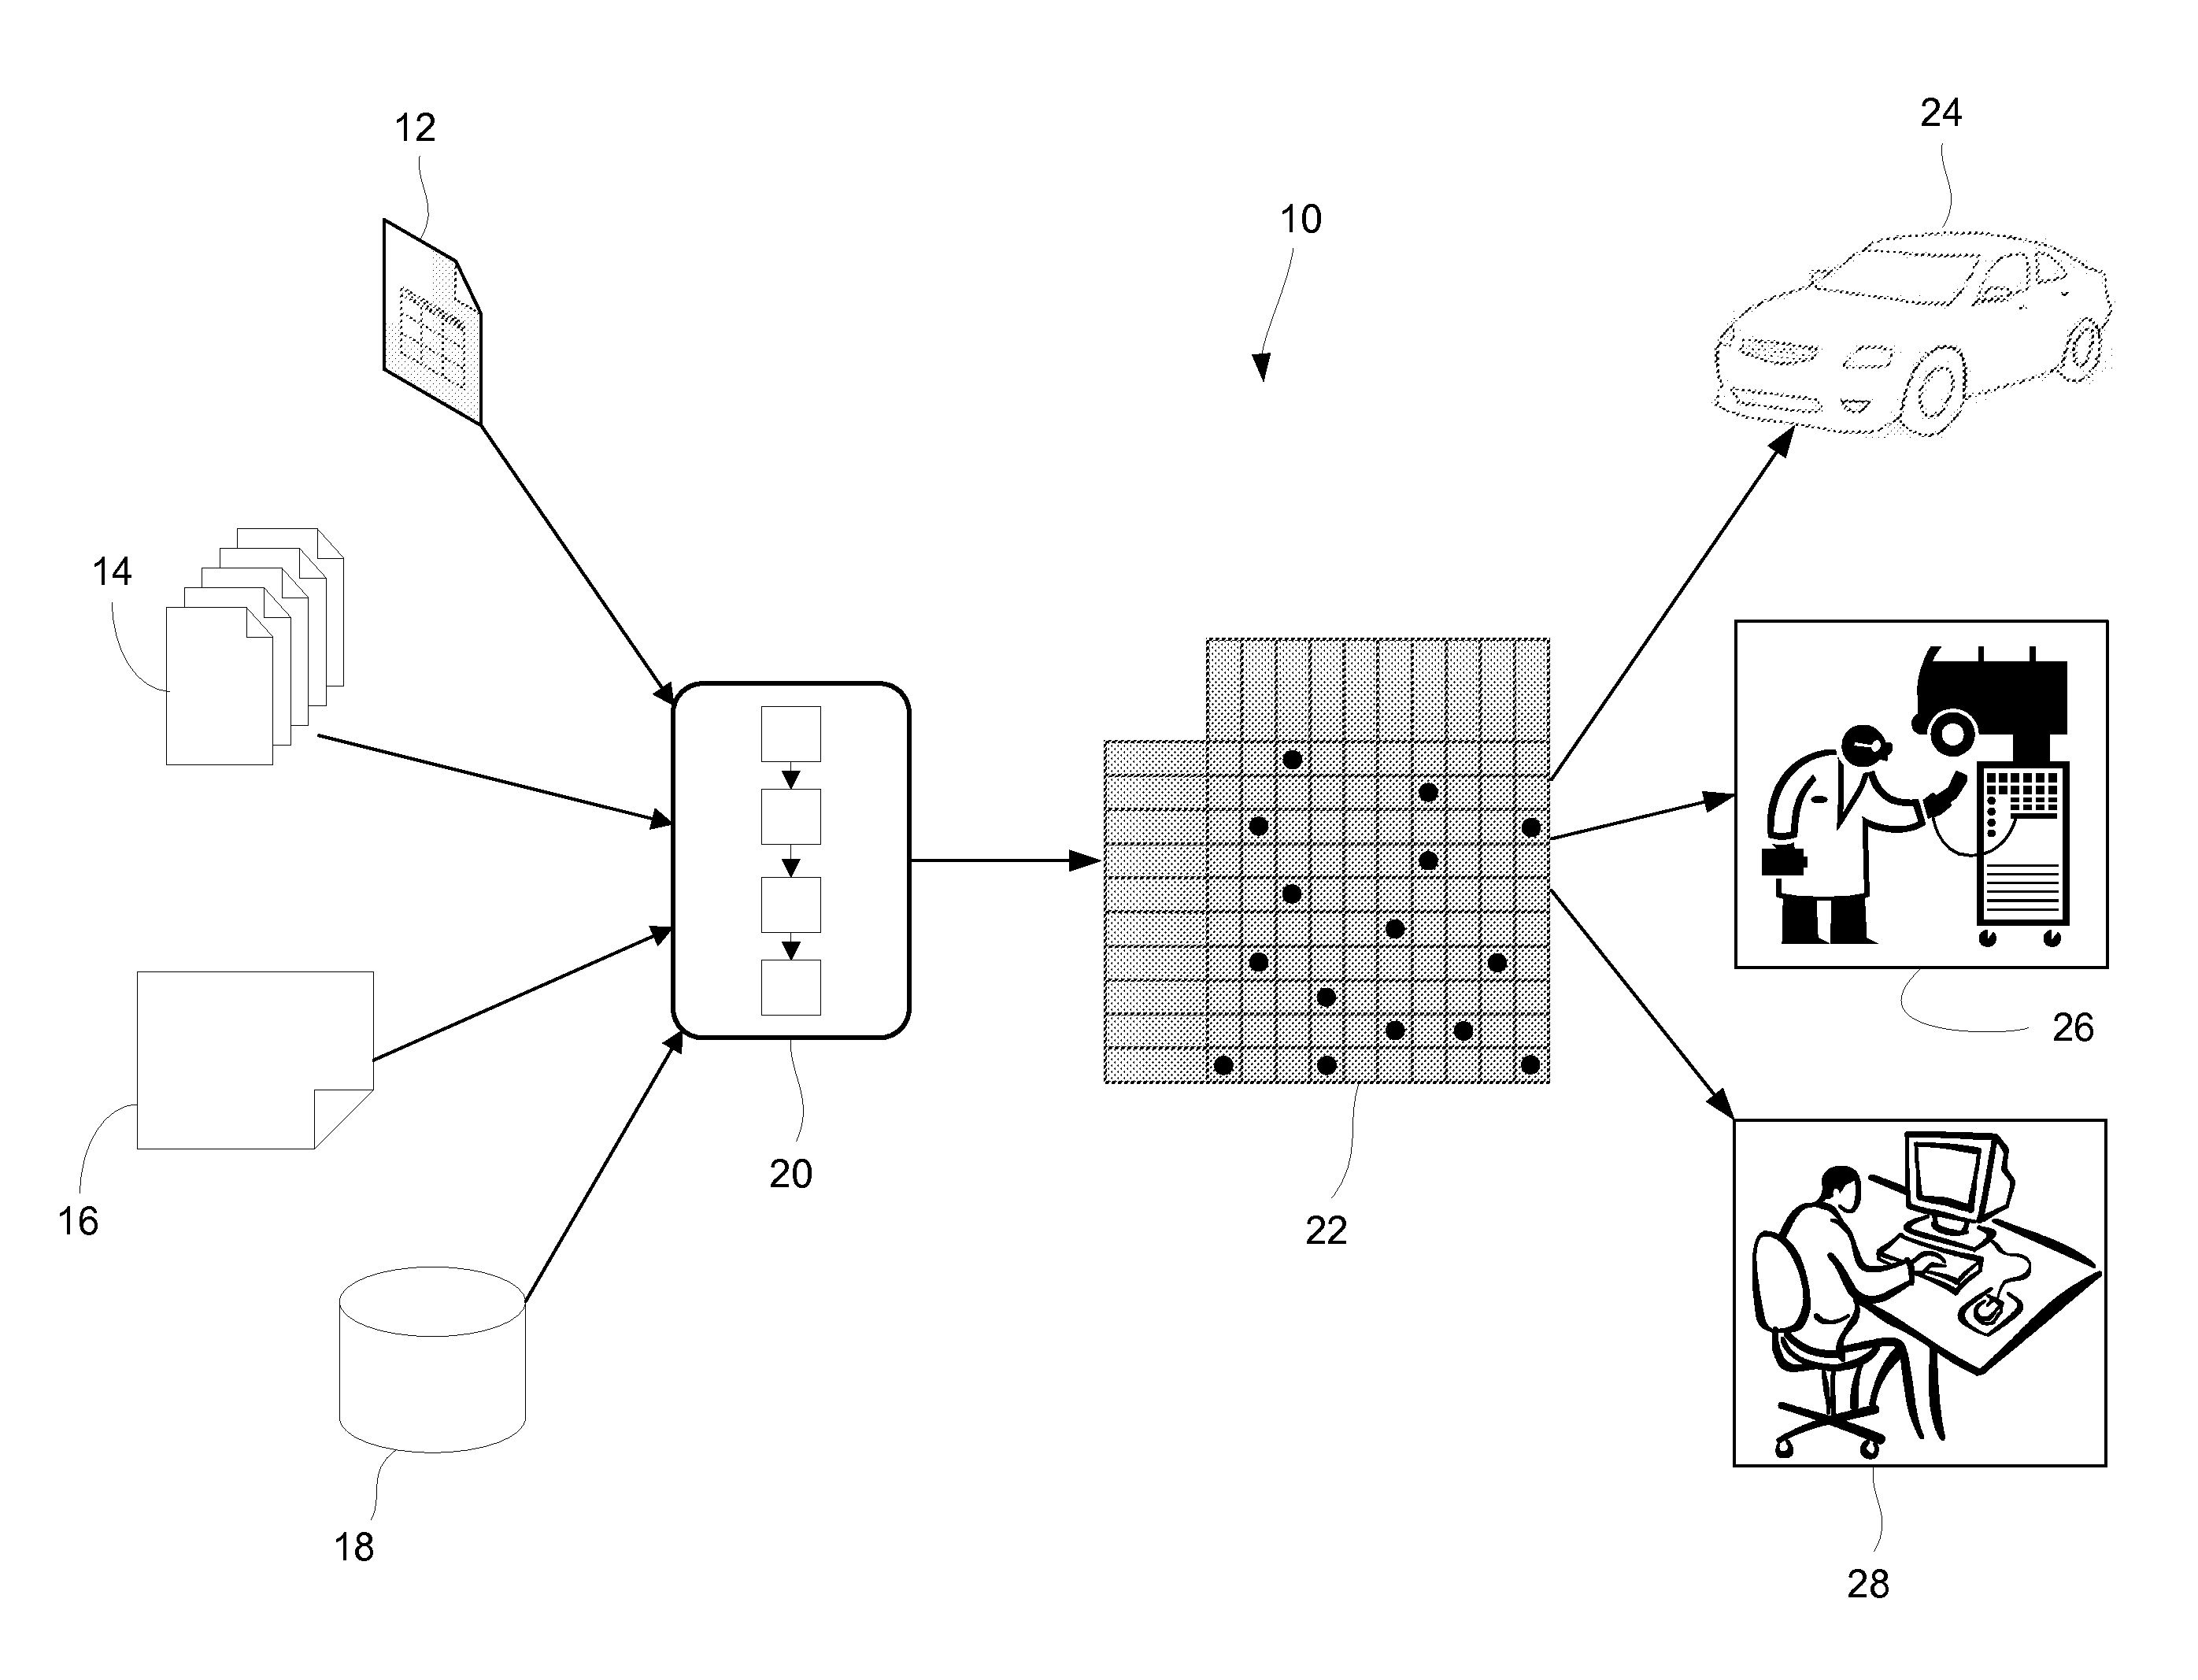
[0007]In accordance with the teachings of the present invention, a method and system are disclosed for comparing and merging fault models which were derived from different data sources. Two or more fault models are first represented as bipartite weighted graphs, which define correlations between failure modes and symptoms. The nodes of the graphs are compared to find failure modes and symptoms which are the same even though the specific terminology may be different. A graph matching method is then used to compare the graphs and determine which failure mode and symptom correlations are common between them. Finally, smoothing techniques and domain expert knowledge are used to merge and update the fault models, producing an integrated fault model which can be used by both off-board and onboard vehicle systems, service facilities, and others.

Problems solved by technology

As with anything, these types of devices and algorithms are susceptible to errors, failures and faults that can affect the operation of the vehicle.
While all of these fault models show the correlations between failure modes and symptoms, there are enough differences between the fault models that it is difficult to compare and combine them directly.
These differences have traditionally meant that the various fault models are used independently of one another, and are never compared in sufficient detail to determine where there may be synergies or inconsistencies between them.
As a result, service procedure documents and onboard and off-board diagnostic tools may not take advantage of all known correlations between failure modes and symptoms.

Method used


Image

  • Graph matching system for comparing and merging fault models
  • Graph matching system for comparing and merging fault models
  • Graph matching system for comparing and merging fault models

Examples


Embodiment Construction

[0015]The following discussion of the embodiments of the invention directed to a method and system for comparing and merging fault models is merely exemplary in nature, and is in no way intended to limit the invention or its applications or uses. For example, the present invention has particular application for vehicle fault diagnosis. However, the invention is equally applicable to fault diagnosis in other industries, such as aerospace and heavy equipment, and to fault diagnosis in any mechanical, electrical, or electro-mechanical system where fault models are used.

[0016]Fault models have long been used by manufacturers of vehicles and other systems to document and understand the correlation between failure modes and associated symptoms. Because fault models can be derived from a variety of data sources, it has traditionally been difficult or impossible to compare different fault models for the same vehicle or system, and gain the benefit of all of the data contained in all of the ...


PUM


Abstract

A method and system for comparing and merging fault models which are derived from different data sources. Two or more fault models are first represented as bipartite weighted graphs, which define correlations between failure modes and symptoms. The nodes of the graphs are compared to find failure modes and symptoms which are the same even though the specific terminology may be different. A graph matching method is then used to compare the graphs and determine which failure mode and symptom correlations are common between them. Finally, smoothing techniques and domain expert knowledge are used to merge and update the fault models, producing an integrated fault model which can be used by onboard vehicle systems, service facilities, and others.

Description

BACKGROUND OF THE INVENTION[0001]1. Field of the Invention[0002]This invention relates generally to a method and system for comparing and merging fault models and, more particularly, to a method and system for comparing and merging fault models derived from different data sources which represents each fault model as a bipartite weighted graph, identifies common failure modes and symptoms between the graphs, compares fault models using a graph matching method, and produces a merged and updated fault model as output.[0003]2. Discussion of the Related Art[0004]Modern vehicles are complex electro-mechanical systems that employ many sub-systems, components, devices, and modules, which pass operating information between and among each other using sophisticated algorithms and data buses. As with anything, these types of devices and algorithms are susceptible to errors, failures and faults that can affect the operation of the vehicle. To help manage this complexity, vehicle manufacturers de...

Claims


Application Information

Patent Timeline
Patent Type & Authority Applications(United States)
IPC IPC(8): G01R31/28G06F11/08
CPCG05B23/0278
Inventor SINGH, SATNAMHOLLAND, STEVEN W.BANDYOPADHYAY, PULAK
Owner GM GLOBAL TECH OPERATIONS LLC
Learn More