Point source detection

a detection method and point source technology, applied in the field of point source detection, to achieve the effect of reducing or eliminating artifacts

Inactive Publication Date: 2011-10-20
ANASTASIA TYURINA
View PDF9 Cites 14 Cited by
  • Summary
  • Abstract
  • Description
  • Claims
  • Application Information

AI Technical Summary

Benefits of technology

[0018]As shown in FIG. 5, this post-processing examines the intensity data (collectively, the intensity flux), and computes several coefficients of Hermit decomposition of the intensity flux. A result is a series of equations that are solved simultaneously to yield a template parameter that, in some embodiments, includes corrected values for the centroids. The corrections have the effect of revealing locations of additional objects that were unresolvable with the common technologies.
[0019]FIG. 5 is a flowchart depictin

Problems solved by technology

Further, the method may be successfully employed in microscopy of diffraction limited florescent entities su

Method used


Image

  • Point source detection
  • Point source detection
  • Point source detection

Examples


Embodiment Construction

[0027]In the method of the current invention, a point spread function is used to characterize the intensity of the point source. In a digital image of point sources, a point spread function of a source located in (x1,y1) is described by Gaussian:

F(x,y)=Fπσ2-(x-x1)2-(y-y1)22σ2Eq.1

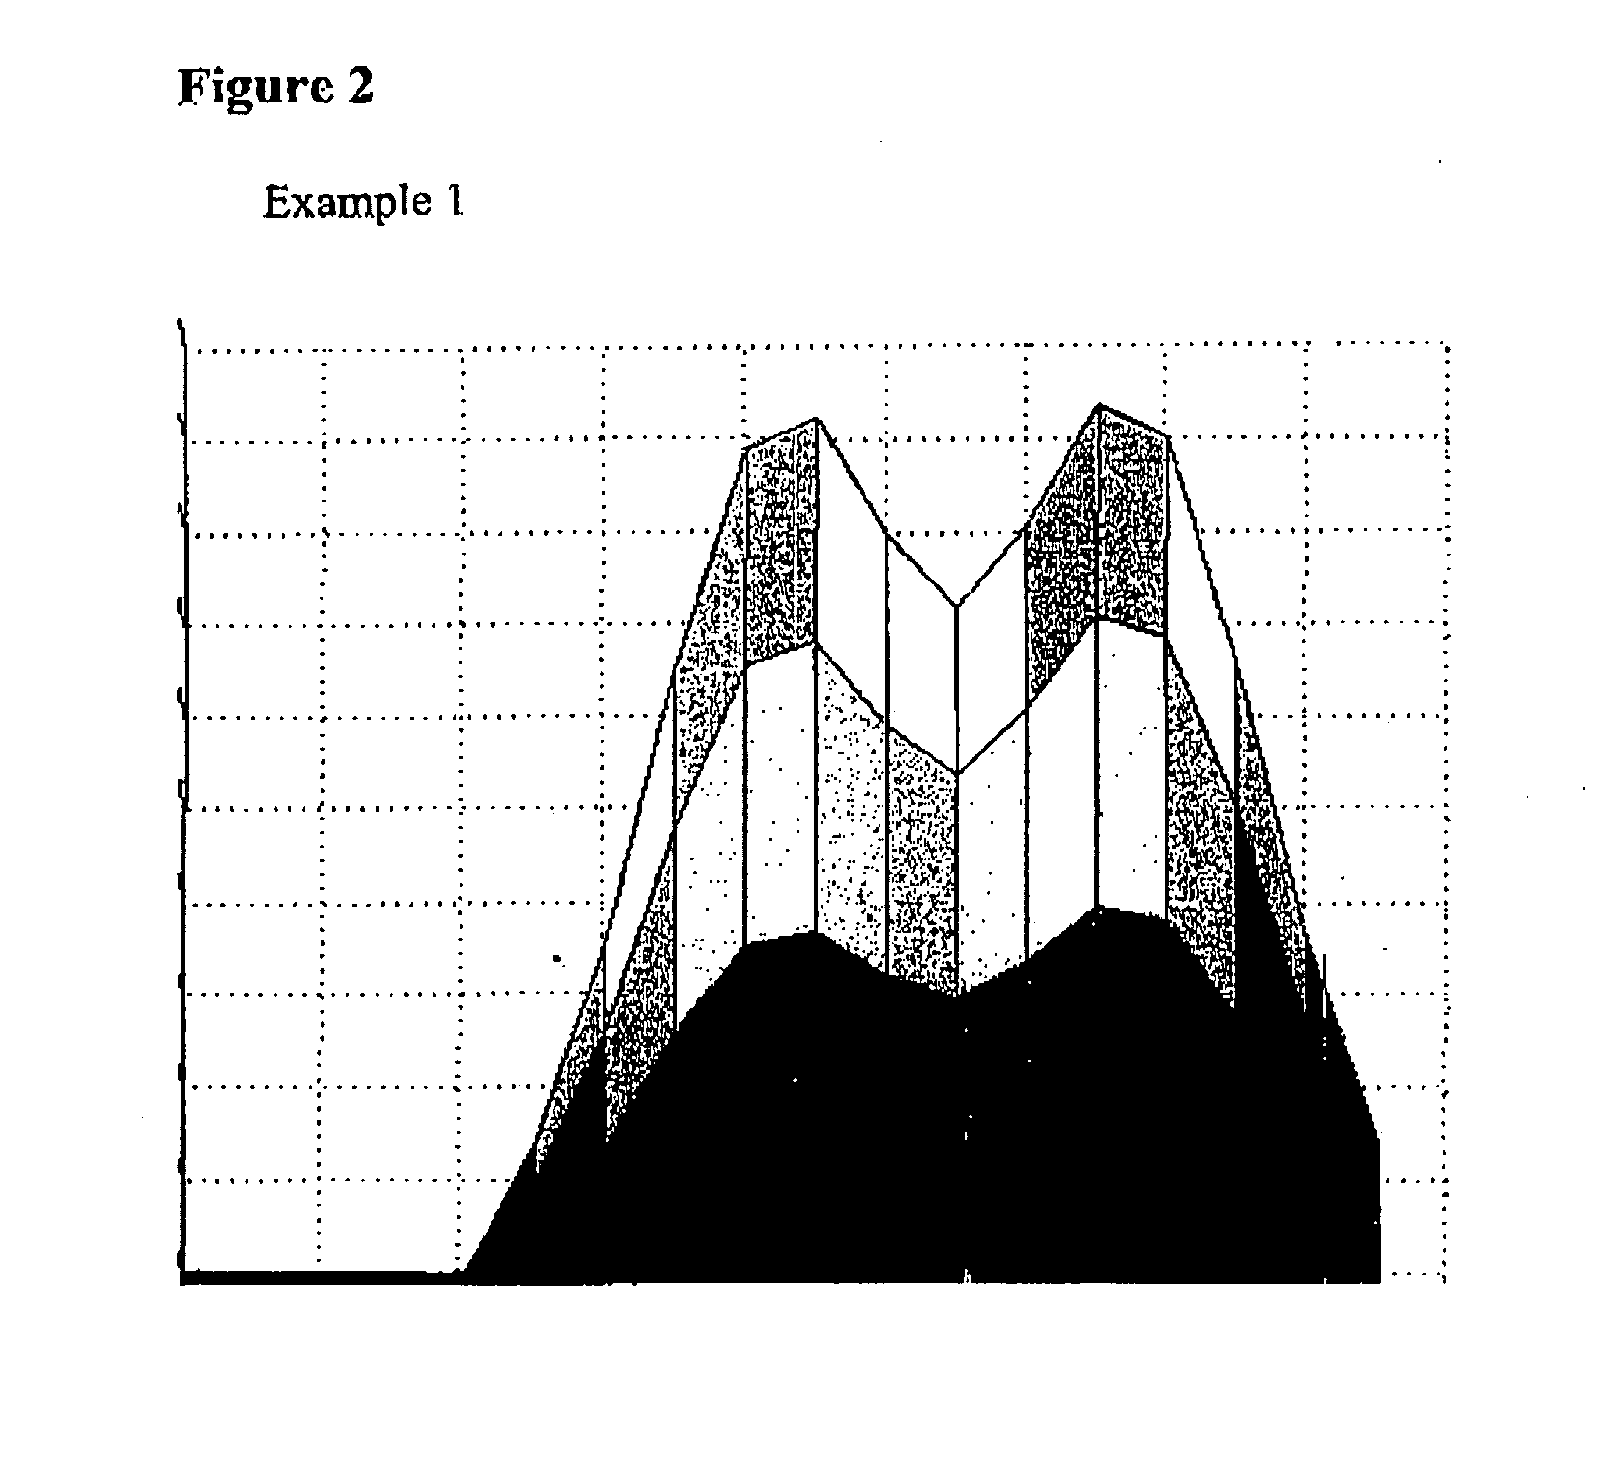
where F is the intensity of the source and σ is a size-parameter defined by optics that produced the digital image. For the purposes of this application, we define the optical resolution of the system, ρ, as a minimal distance between the two point sources that allow for the optical resolution of the two sources. The point sources are considered optically resolved if a point spread function has a minimum point between them. The resolved and unresolved sources are exemplified in FIG. 1. Let's consider Example 1 and Example 2, represented in FIG. 2. For Example 1, two point sources are located at a distance d, d>ρ, where ρ is an optical resolution. For Example 2, two point sources are located at a distance d, ...


PUM


Abstract

The invention provides a technique for accurate detection of objects appearing in the image, such as single fluorescent molecules, cells, microorganisms, nucleotides, DNA strands, or stars in celestial images. The method allows to differentiate between two combined point sources even if they are closer to each other than the optical resolution of the system. The procedure involves computing several coefficients representing decomposition of the intensity data in the basis of Hermit functions. In the case when the objects are distributed randomly and higher yield of accurately detected objects is desired, the method allows for a tenfold increase in such yield.

Description

[0001]Deblending in Source Extractor is performed by examining an intensity profile of the objects appearing in an image and comparing that profile to a threshold. This is described in, for example, B. W. Holwerda, Source Extractor for Dummies 32-34 (Space Telescope Science Institute, Baltimore, Md.) and also in E. Bertin, SExtractor v2.3 User's Manual 20-22 (Institue d'Astrophysique & Observatoire de Paris). This technique in accordance with the Rayleigh criterion is generally unable to resolve individual objects that are closer than about 1.5 times their full-width half-max (FWHM). FWHM is an important measure of the quality of an imaging device and its spatial resolution. If the distribution is Gaussian, then the FWHM can be calculated as FWHM=σ2*√{square root over (−2*log(0.5))}, where σ is the standard deviation, or the square root of the variance. FWGM is also the bandwidth of the system. The Rayleigh criterion is the generally accepted criterion for the minimum optically reso...

Claims


Application Information

Patent Timeline
IPC IPC(8): H04N5/225G06K9/46G06V20/13
CPCG06K9/00134G06T5/003G06K9/0063G06V20/693G06V20/13
Inventor TYURINA, ANASTASIA
Owner ANASTASIA TYURINA
Why Eureka
Try Eureka