Method and system for reduced energy in a beverage machine
- Summary
- Abstract
- Description
- Claims
- Application Information
AI Technical Summary
Benefits of technology
Problems solved by technology
Method used
Image
Examples
experiment 1
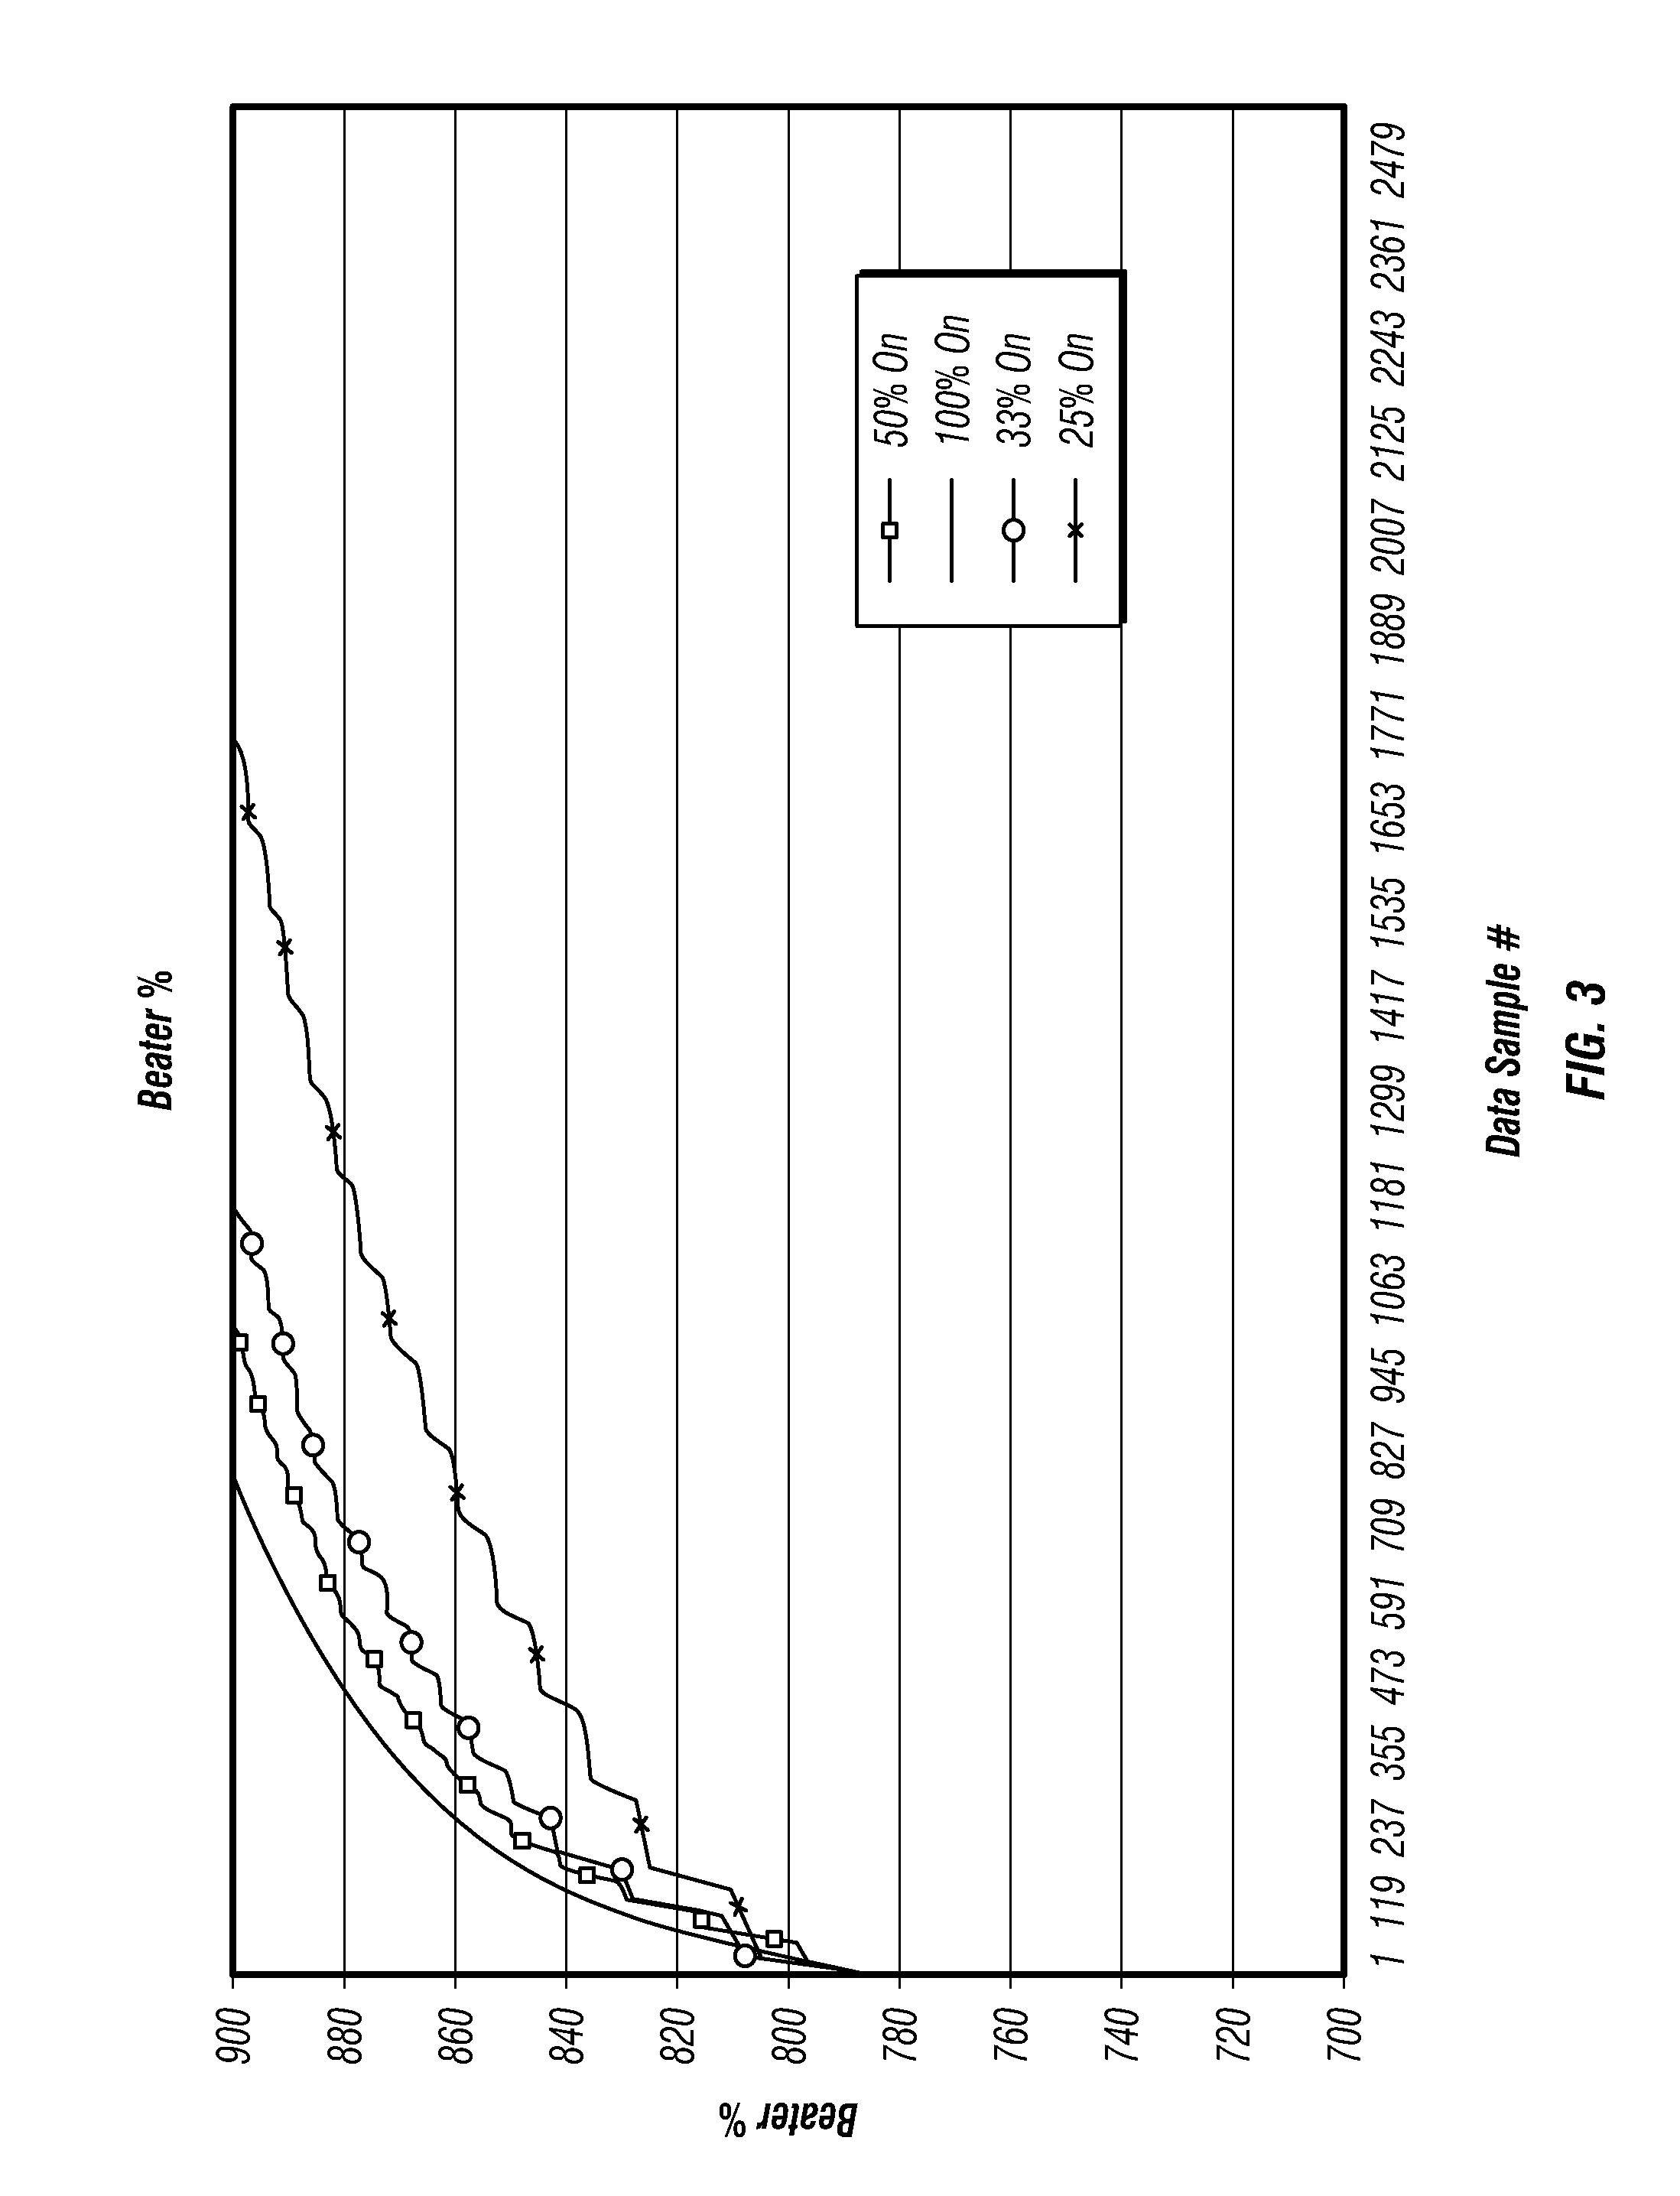
[0034]FIG. 3 is a chart of exemplary test data for a beverage machine illustrating different viscosity change rates of a frozen beverage for different activation / deactivation periods as a function of time. As a non-limiting example of test data that can be developed according to the teachings of this disclosure, FIG. 3 illustrates the viscosity of a beverage viscosity changing with temperature, such as a frozen beverage, over time and the effect that different activation / deactivation times can have on the viscosity changes and other product conditions. While the viscosity can be measured or determined in a number of ways, one exemplary method is to measure power input to the mixer motor, as described above. Power input in watts can be measured over time as one or more product conditions change. In other embodiments, temperature can be measured directly. Other conditions suitable to the type of beverage can also be measured in addition to or in lieu of viscosity.
[0035]The units in th...
PUM
 Abstract
Description
Claims
Application Information
 - R&D
- Intellectual Property
- Life Sciences
- Materials
- Tech Scout
- Unparalleled Data Quality
- Higher Quality Content
- 60% Fewer Hallucinations
Browse by: Latest US Patents, China's latest patents, Technical Efficacy Thesaurus, Application Domain, Technology Topic, Popular Technical Reports.
© 2025 PatSnap. All rights reserved.Legal|Privacy policy|Modern Slavery Act Transparency Statement|Sitemap|About US| Contact US: help@patsnap.com


