Detection of gene duplications
a gene duplication and detection technology, applied in the field of gene analysis, can solve the problem that the composition analysis of the genome does not always reveal candidate genetic anomalies
- Summary
- Abstract
- Description
- Claims
- Application Information
AI Technical Summary
Benefits of technology
Problems solved by technology
Method used
Image

Examples
example 1
[0079]Gene deletions, as well as single nucleotide polymorphisms (SNPs), in the cytochrome P450 and glutathione S-transferase families have been associated with variation in drug metabolism and with certain cancers. The following is a non-limiting example of a method of the present teachings to determine the copy number (0, 1, or 2) of CYP2D6, GSTM1 and GSTT1 genes in a population of individuals. Real-time quantitative PCR simultaneously measures the threshold cycle values of the target gene amplification (CYP2D6, GSTM1, or GSTT1) and the reference gene amplification (RNaseP, which is present in one copy per haploid genome). ΔCT can be determined by subtracting the reference CT from the target CT, and relative quantity can be calculated by 2−2T-calibrator CT. This 2−ΔΔCT formula is described in detail above. The copy number, or “gene dosage”, can be the product of 2 and the relative quantity.
[0080]The gene dosage method takes advantage of a TaqMan® assay using a sequence detection s...
example 2
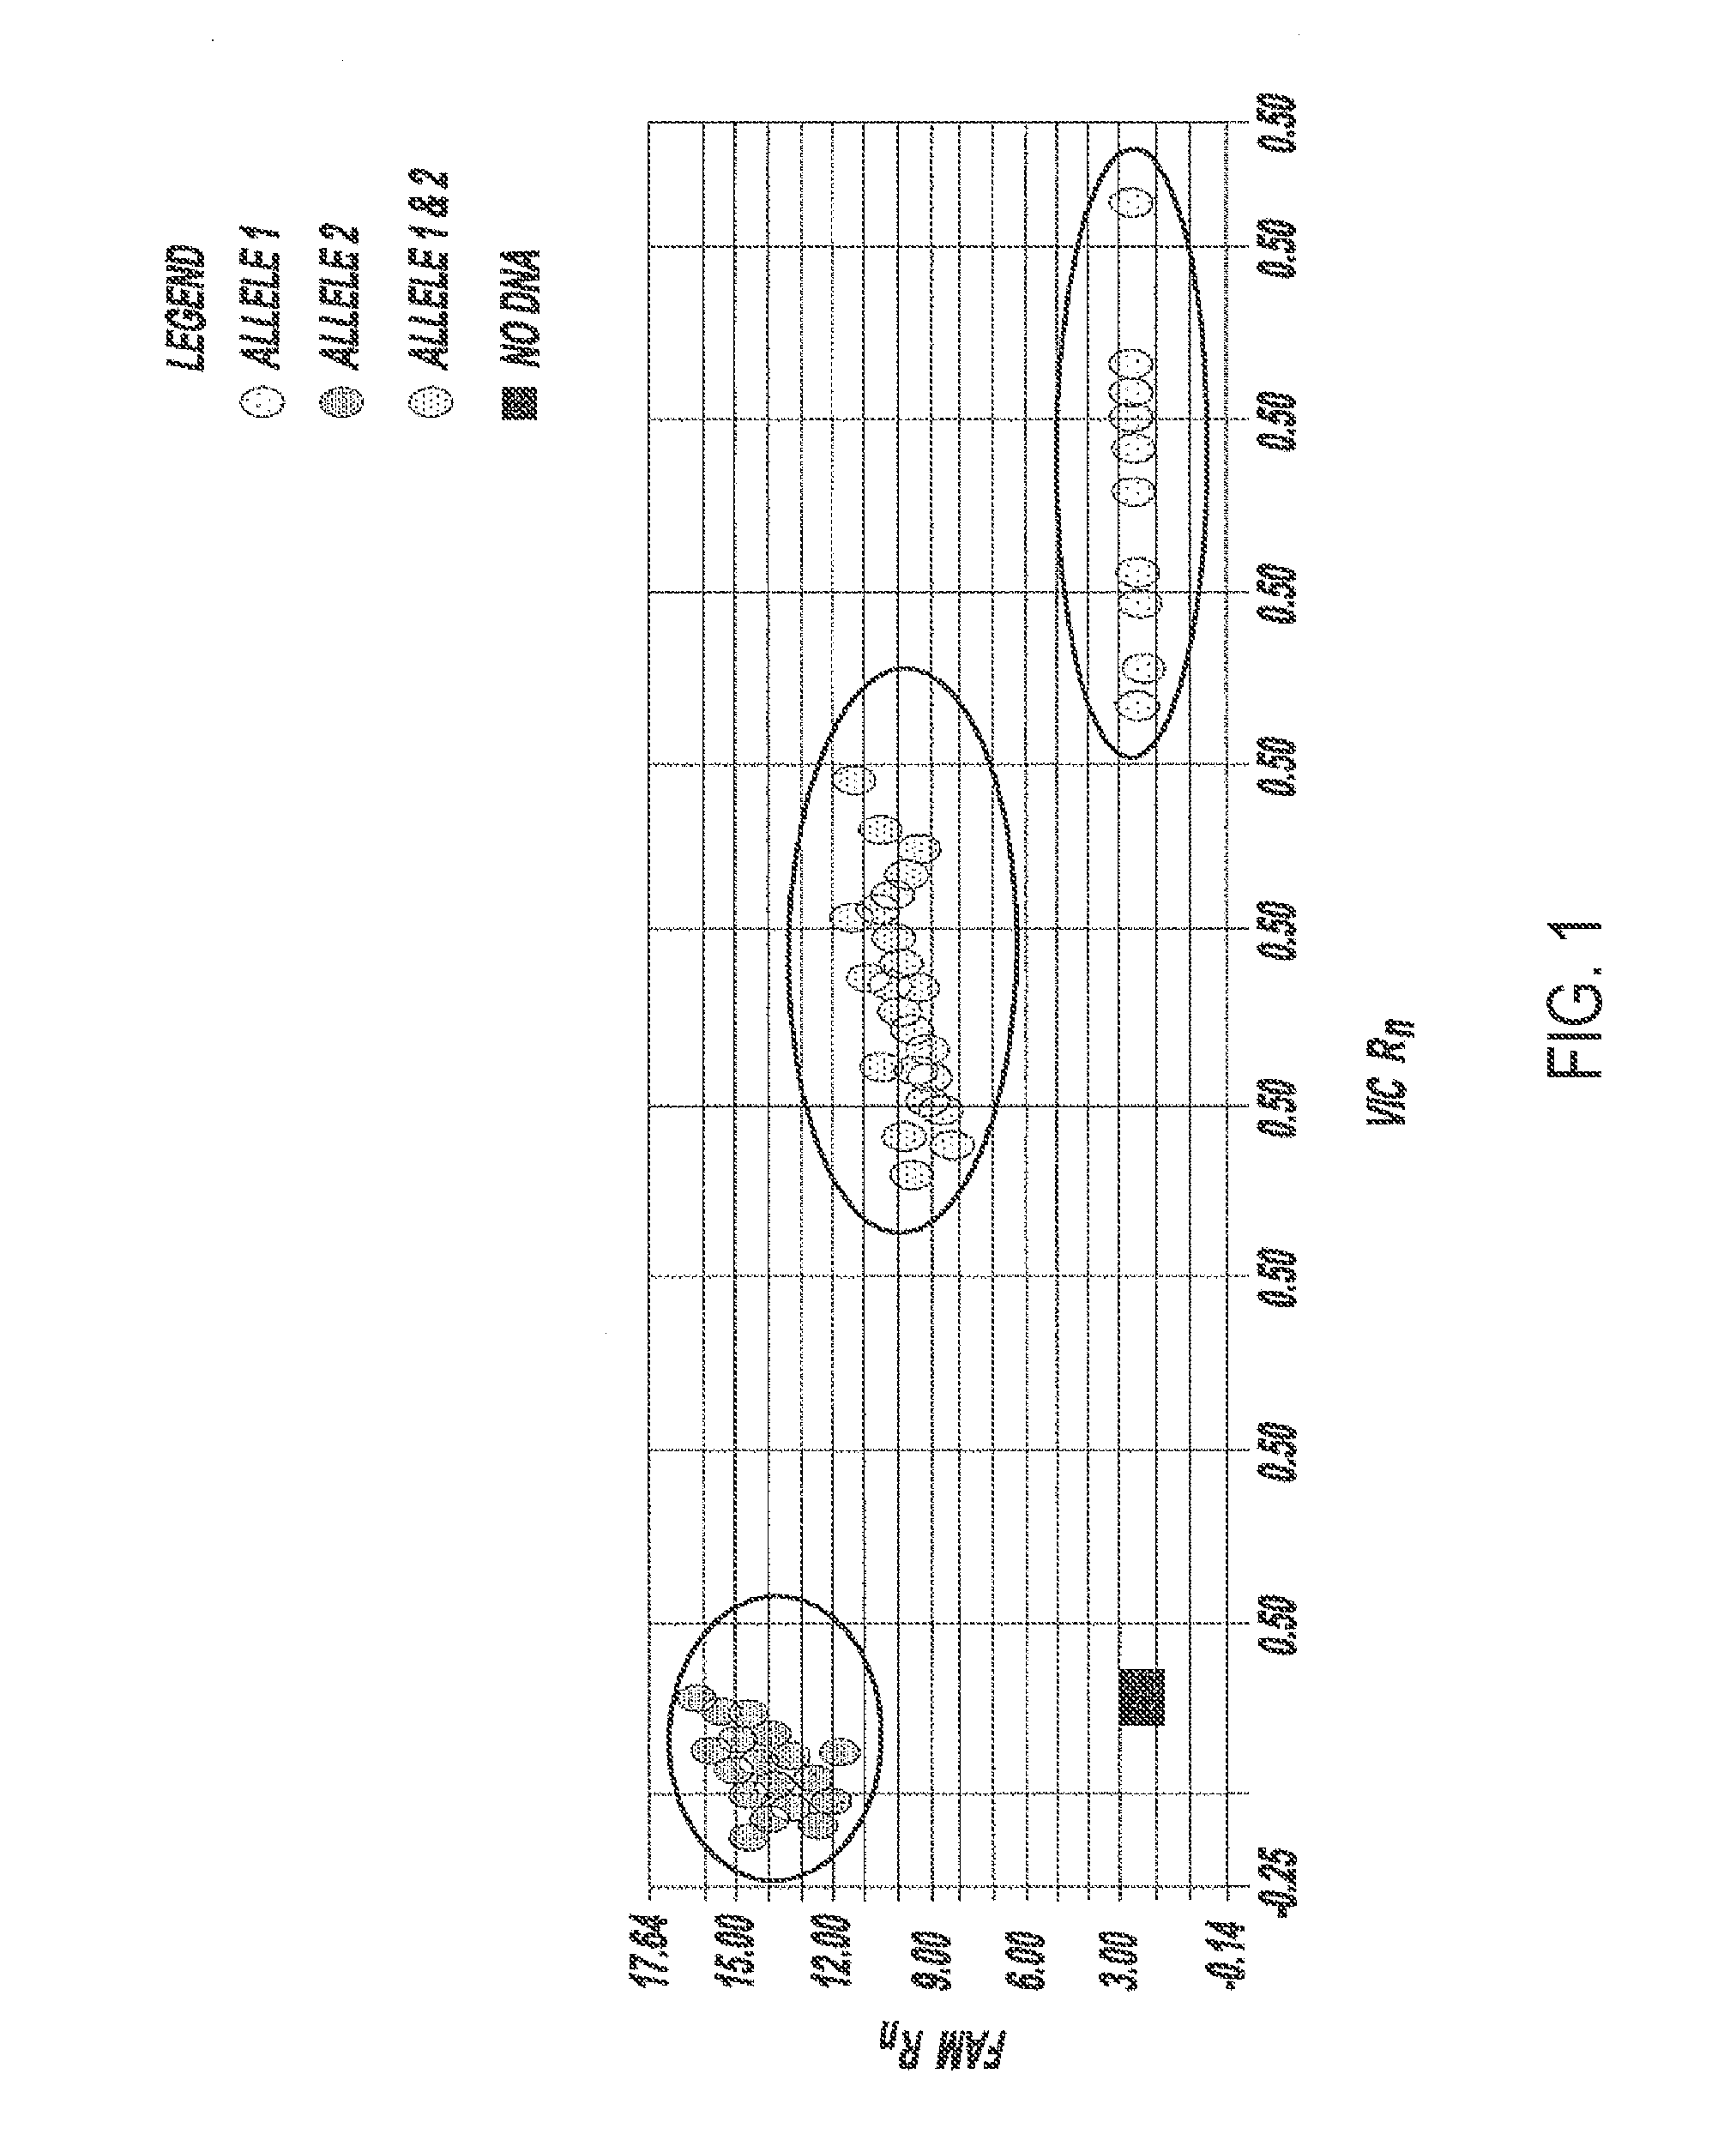
[0085]This example illustrates a method for detecting a candidate genetic anomaly in a population. First, a fluorogenic SNP genotyping an assay is performed using TaqMan® probes and primers and the data is displayed on a graphical interface, resulting in a data readout similar to that shown in FIG. 4, upper left panel. In this display, there are clusters representing individuals homozygous for each SNP allele, as well as a cluster representing individuals heterozygous for both SNP alleles. In addition, there are two groups of data points (circled) which do not fall within any of the clusters. These data points represent individuals whose genomes comprise a candidate genetic anomaly such as a candidate genetic duplication.
example 3
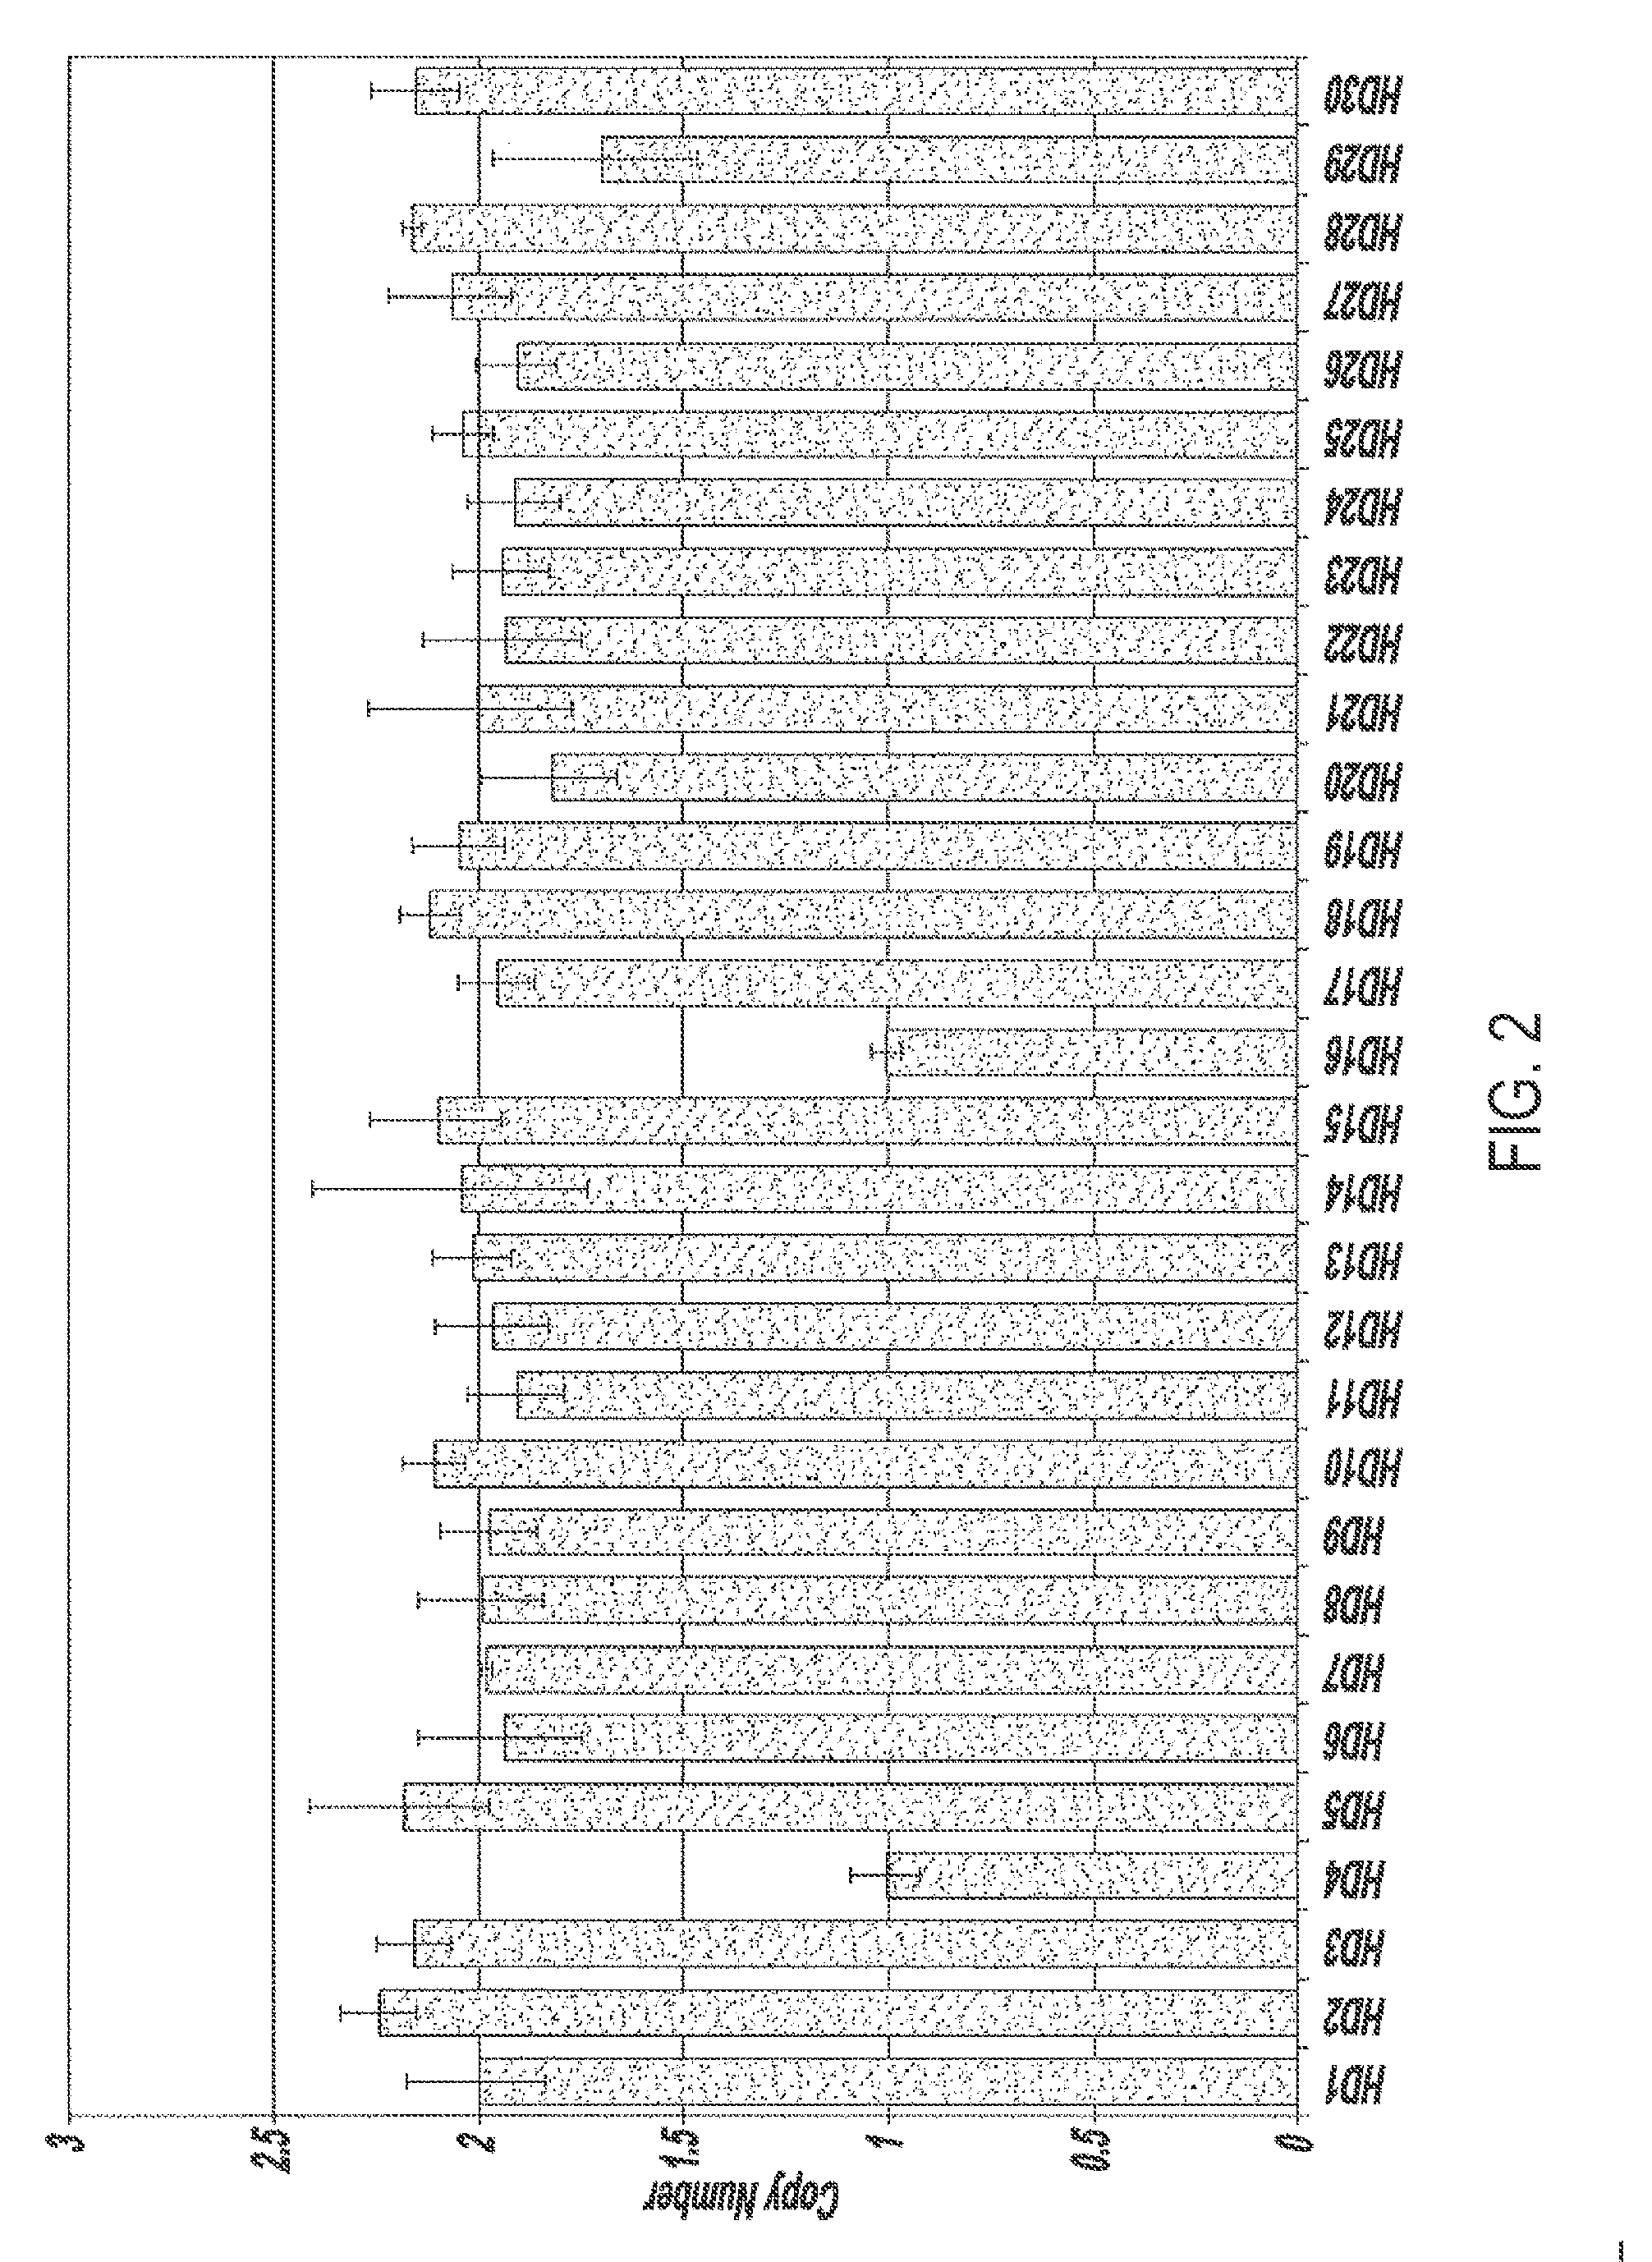
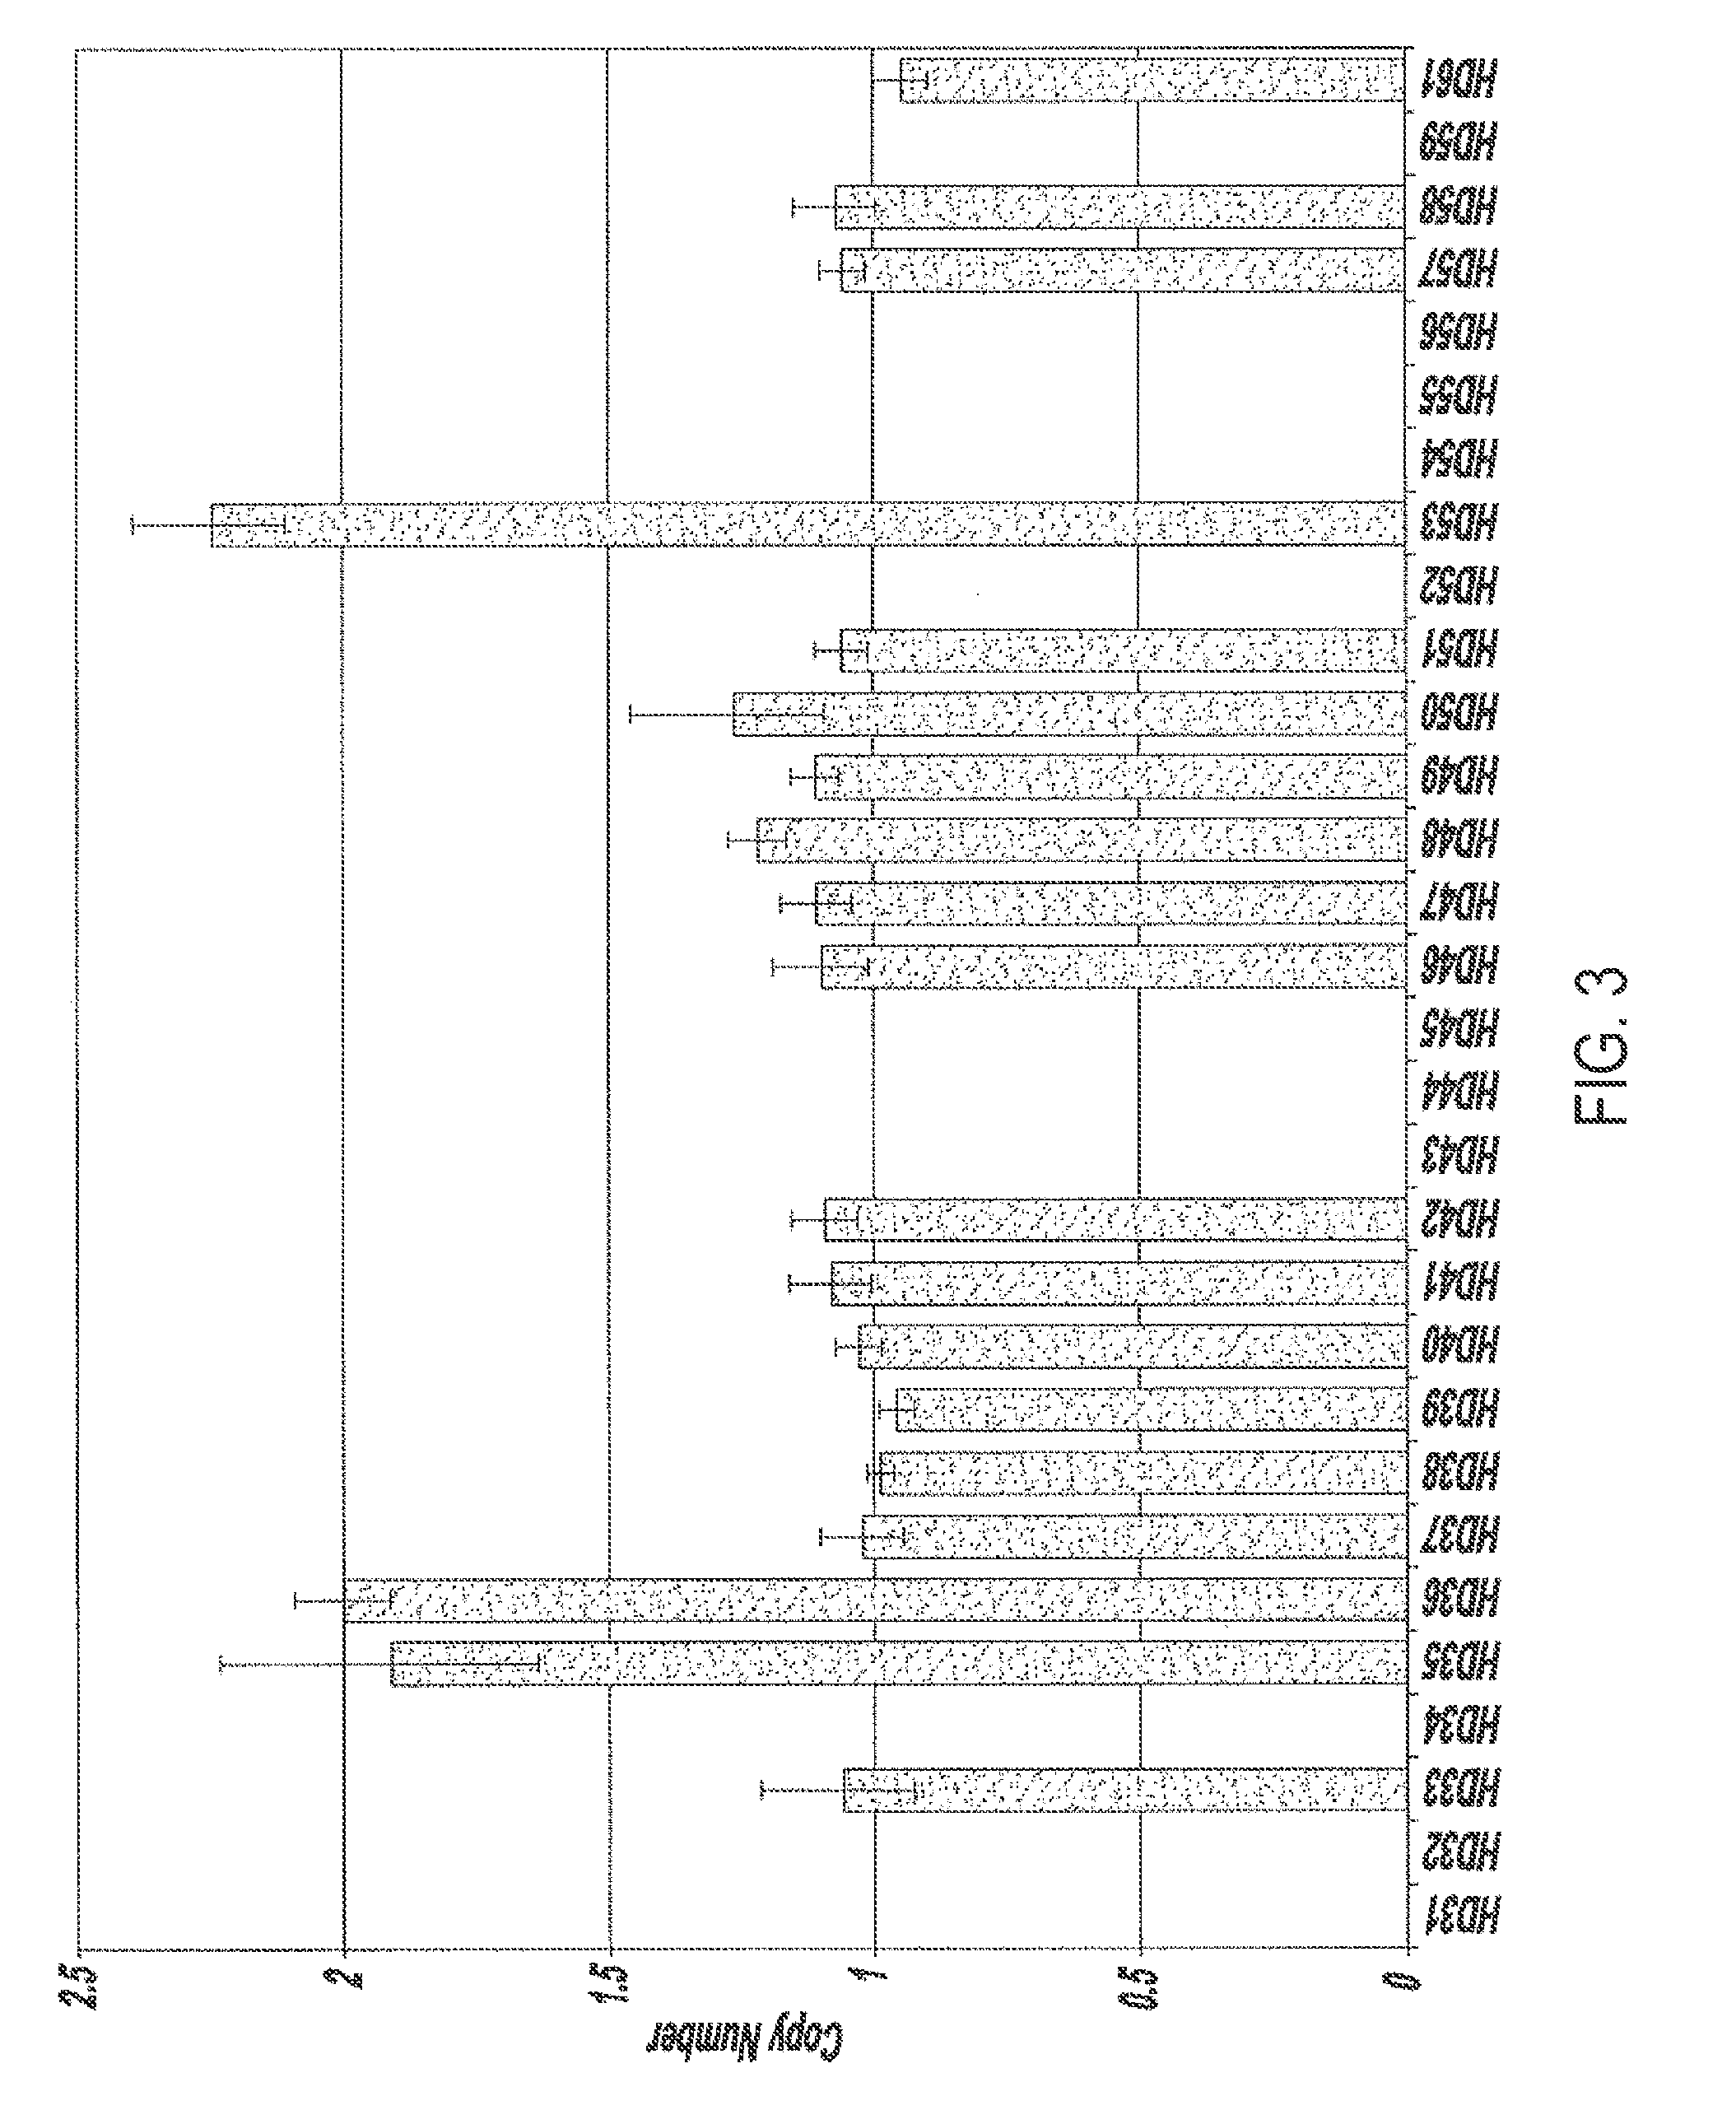
[0086]This example illustrates a method for quantifying sequence copy number in individual genomes comprising a candidate genetic anomaly. In this example, genomes of individuals represented in the data of Example 2 comprising a genetic anomaly were analyzed for gene copy number. Real time quantitative PCR was used to measure the threshold cycle values of a target gene amplification (CYP2E1) and a reference gene amplification (RnaseP, which is present in one copy per haploid genome). Data was analyzed using a 2−ΔΔCT method as described supra.
[0087]As shown in FIG. 5, there is unambiguous discrimination and identification of 6 individuals comprising 3 copies of the CYP2E1 gene and 22 individuals comprising 2 copies of the CYP2E1 gene.
PUM
| Property | Measurement | Unit |
|---|---|---|
| fluorescence intensities | aaaaa | aaaaa |
| fluorescence intensity | aaaaa | aaaaa |
| compositions | aaaaa | aaaaa |
Abstract
Description
Claims
Application Information
 - R&D
- Intellectual Property
- Life Sciences
- Materials
- Tech Scout
- Unparalleled Data Quality
- Higher Quality Content
- 60% Fewer Hallucinations
Browse by: Latest US Patents, China's latest patents, Technical Efficacy Thesaurus, Application Domain, Technology Topic, Popular Technical Reports.
© 2025 PatSnap. All rights reserved.Legal|Privacy policy|Modern Slavery Act Transparency Statement|Sitemap|About US| Contact US: help@patsnap.com