
Image processing system, image processing method, and computer program product

a technology of image processing and image processing method, applied in the field of image processing system, image processing method, and computer program product, can solve the problems of color signal departing from the color reproduction region, requiring more calculation work and longer processing time, and unable to perform automatic contrast enhancement for various types of subjects

Active Publication Date: 2008-09-11
OLYMPUS CORP
View PDF8 Cites 31 Cited by
  • Summary
  • Abstract
  • Description
  • Claims
  • Application Information

AI Technical Summary

Problems solved by technology

In U.S. Pat. No. 3,465,226, the weighting interpolation is inevitable for each pixel for the purpose of maintaining the continuity between the regions, which may demand more calculation work and longer processing time.
When the disclosed technology expected to be used for the luminance signal is applied to the color image signal, such problem as having the color signal departing from the color reproduction region may occur.
Though the technology may be appliable to the medical image under the limited shooting condition, the appropriate contrast enhancement cannot be performed automatically with respect to the various types of subject.

Method used


Image

  • Image processing system, image processing method, and computer program product
  • Image processing system, image processing method, and computer program product
  • Image processing system, image processing method, and computer program product

Examples


embodiment 1

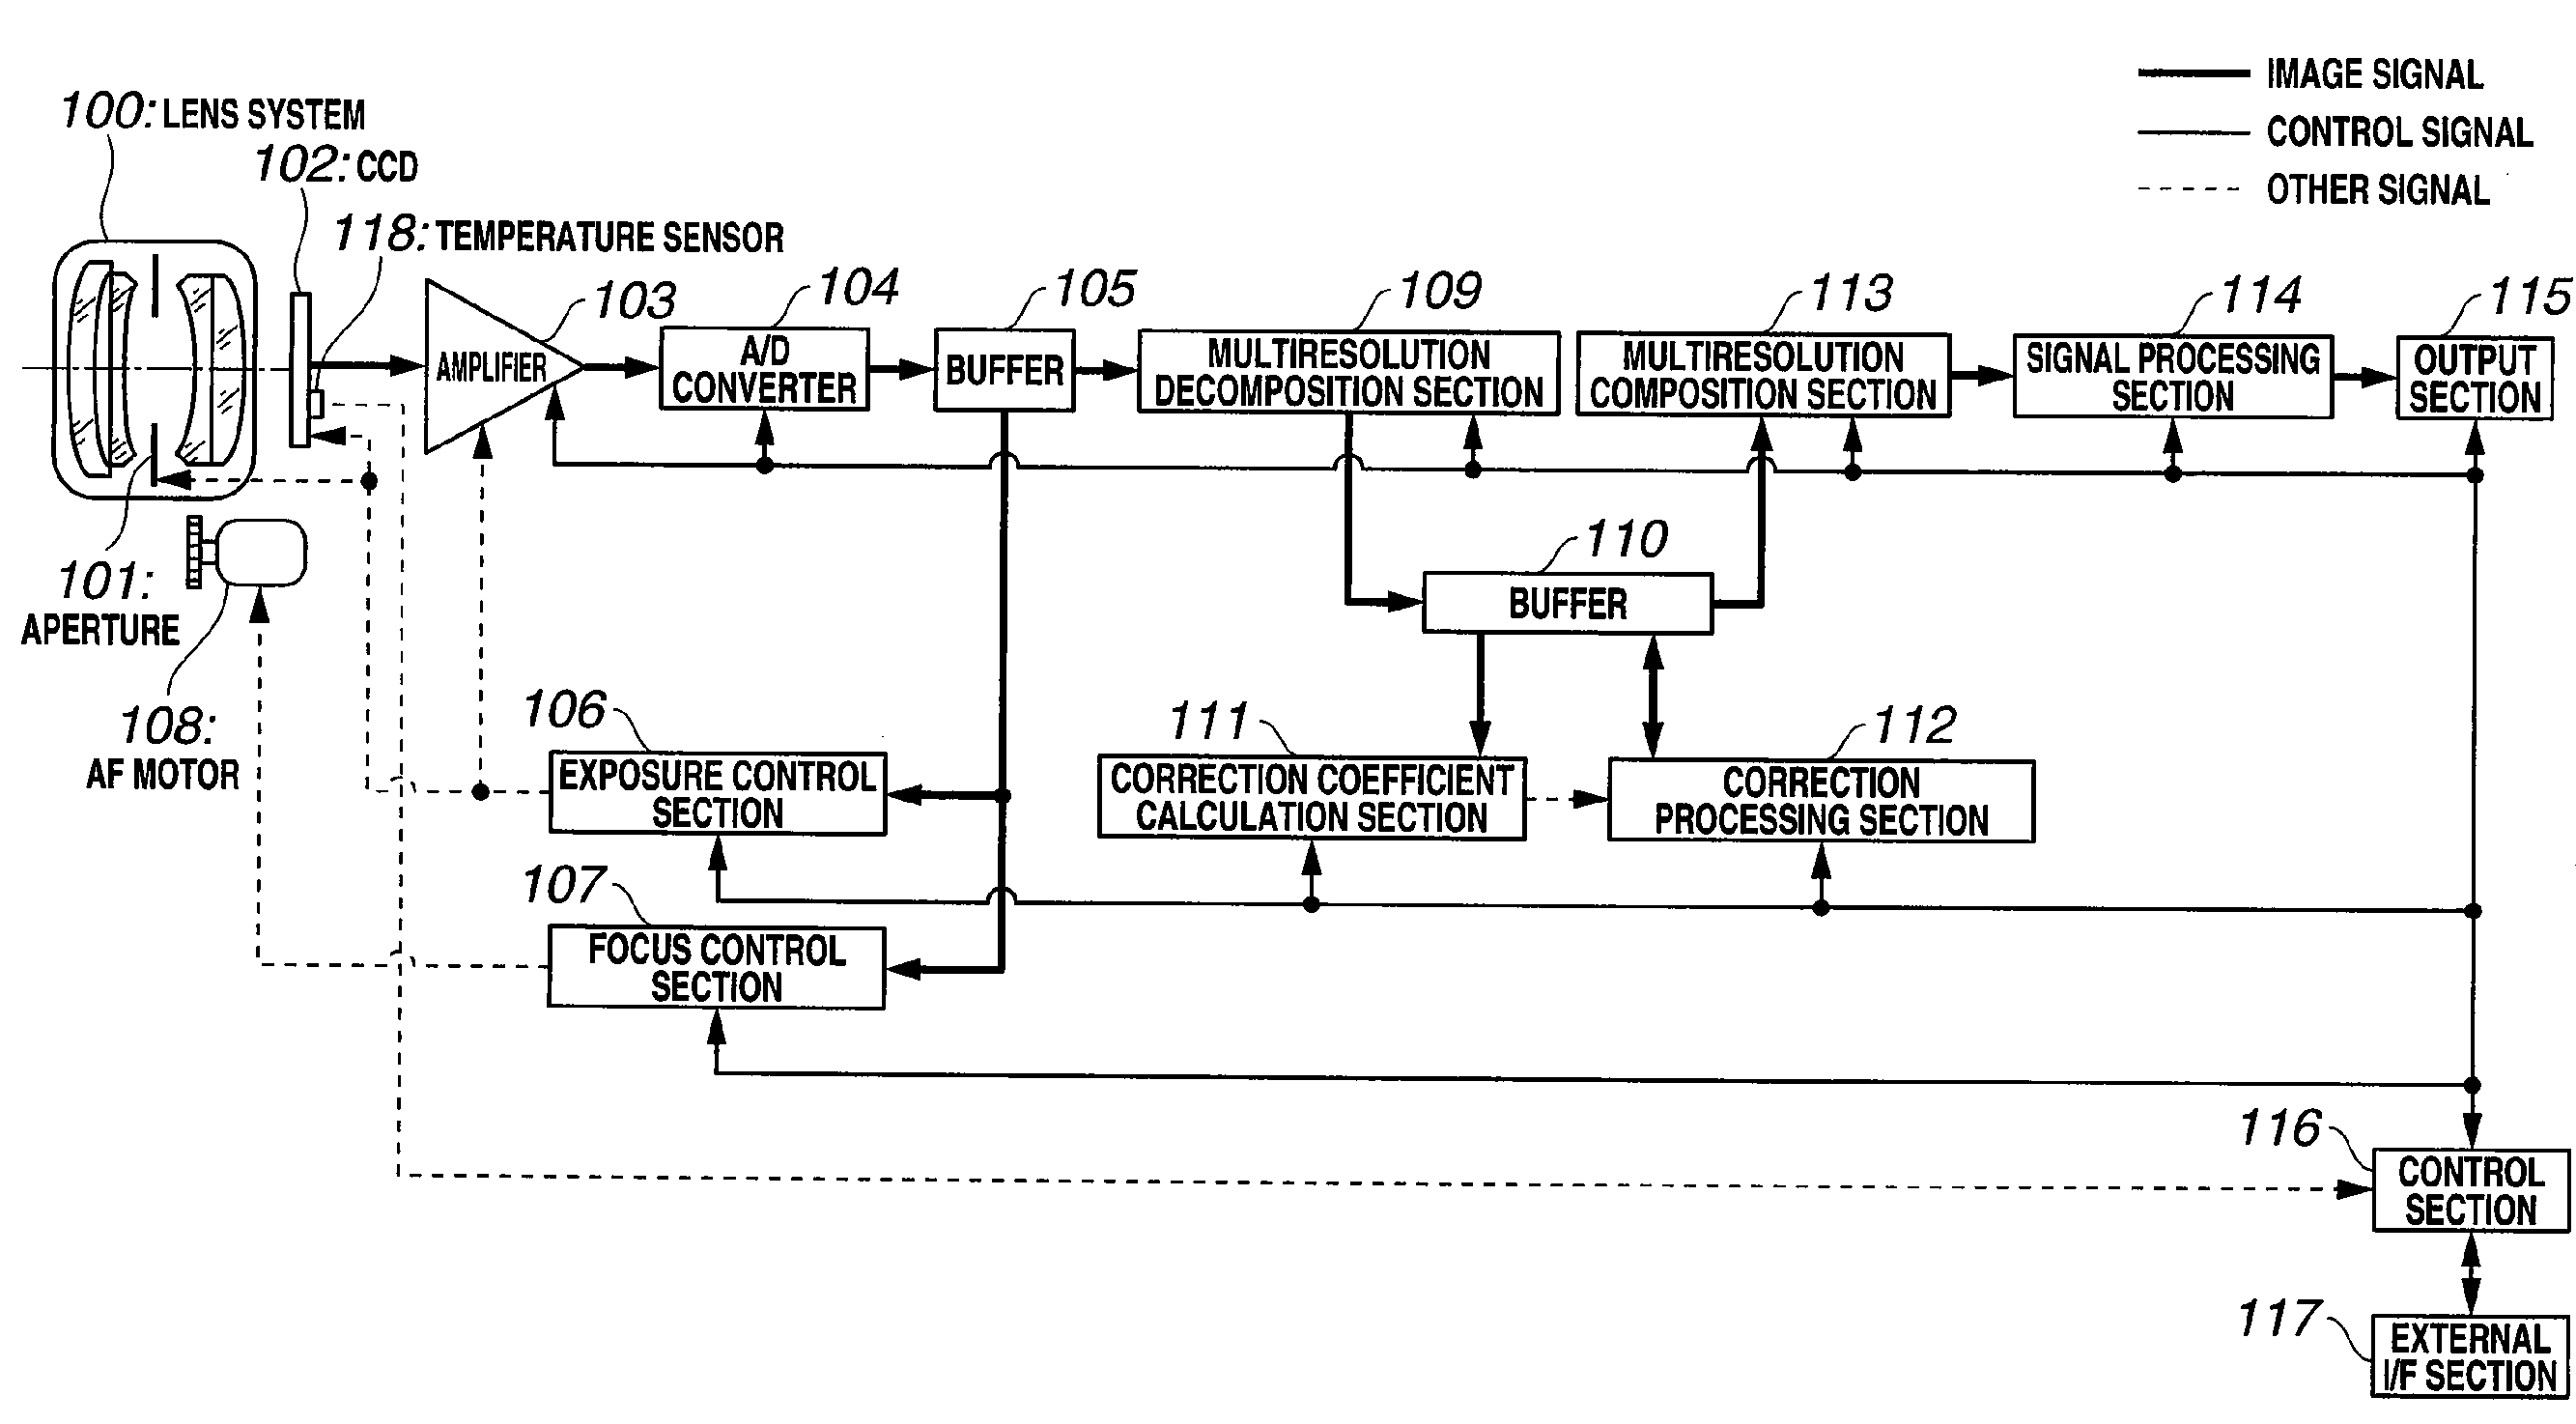
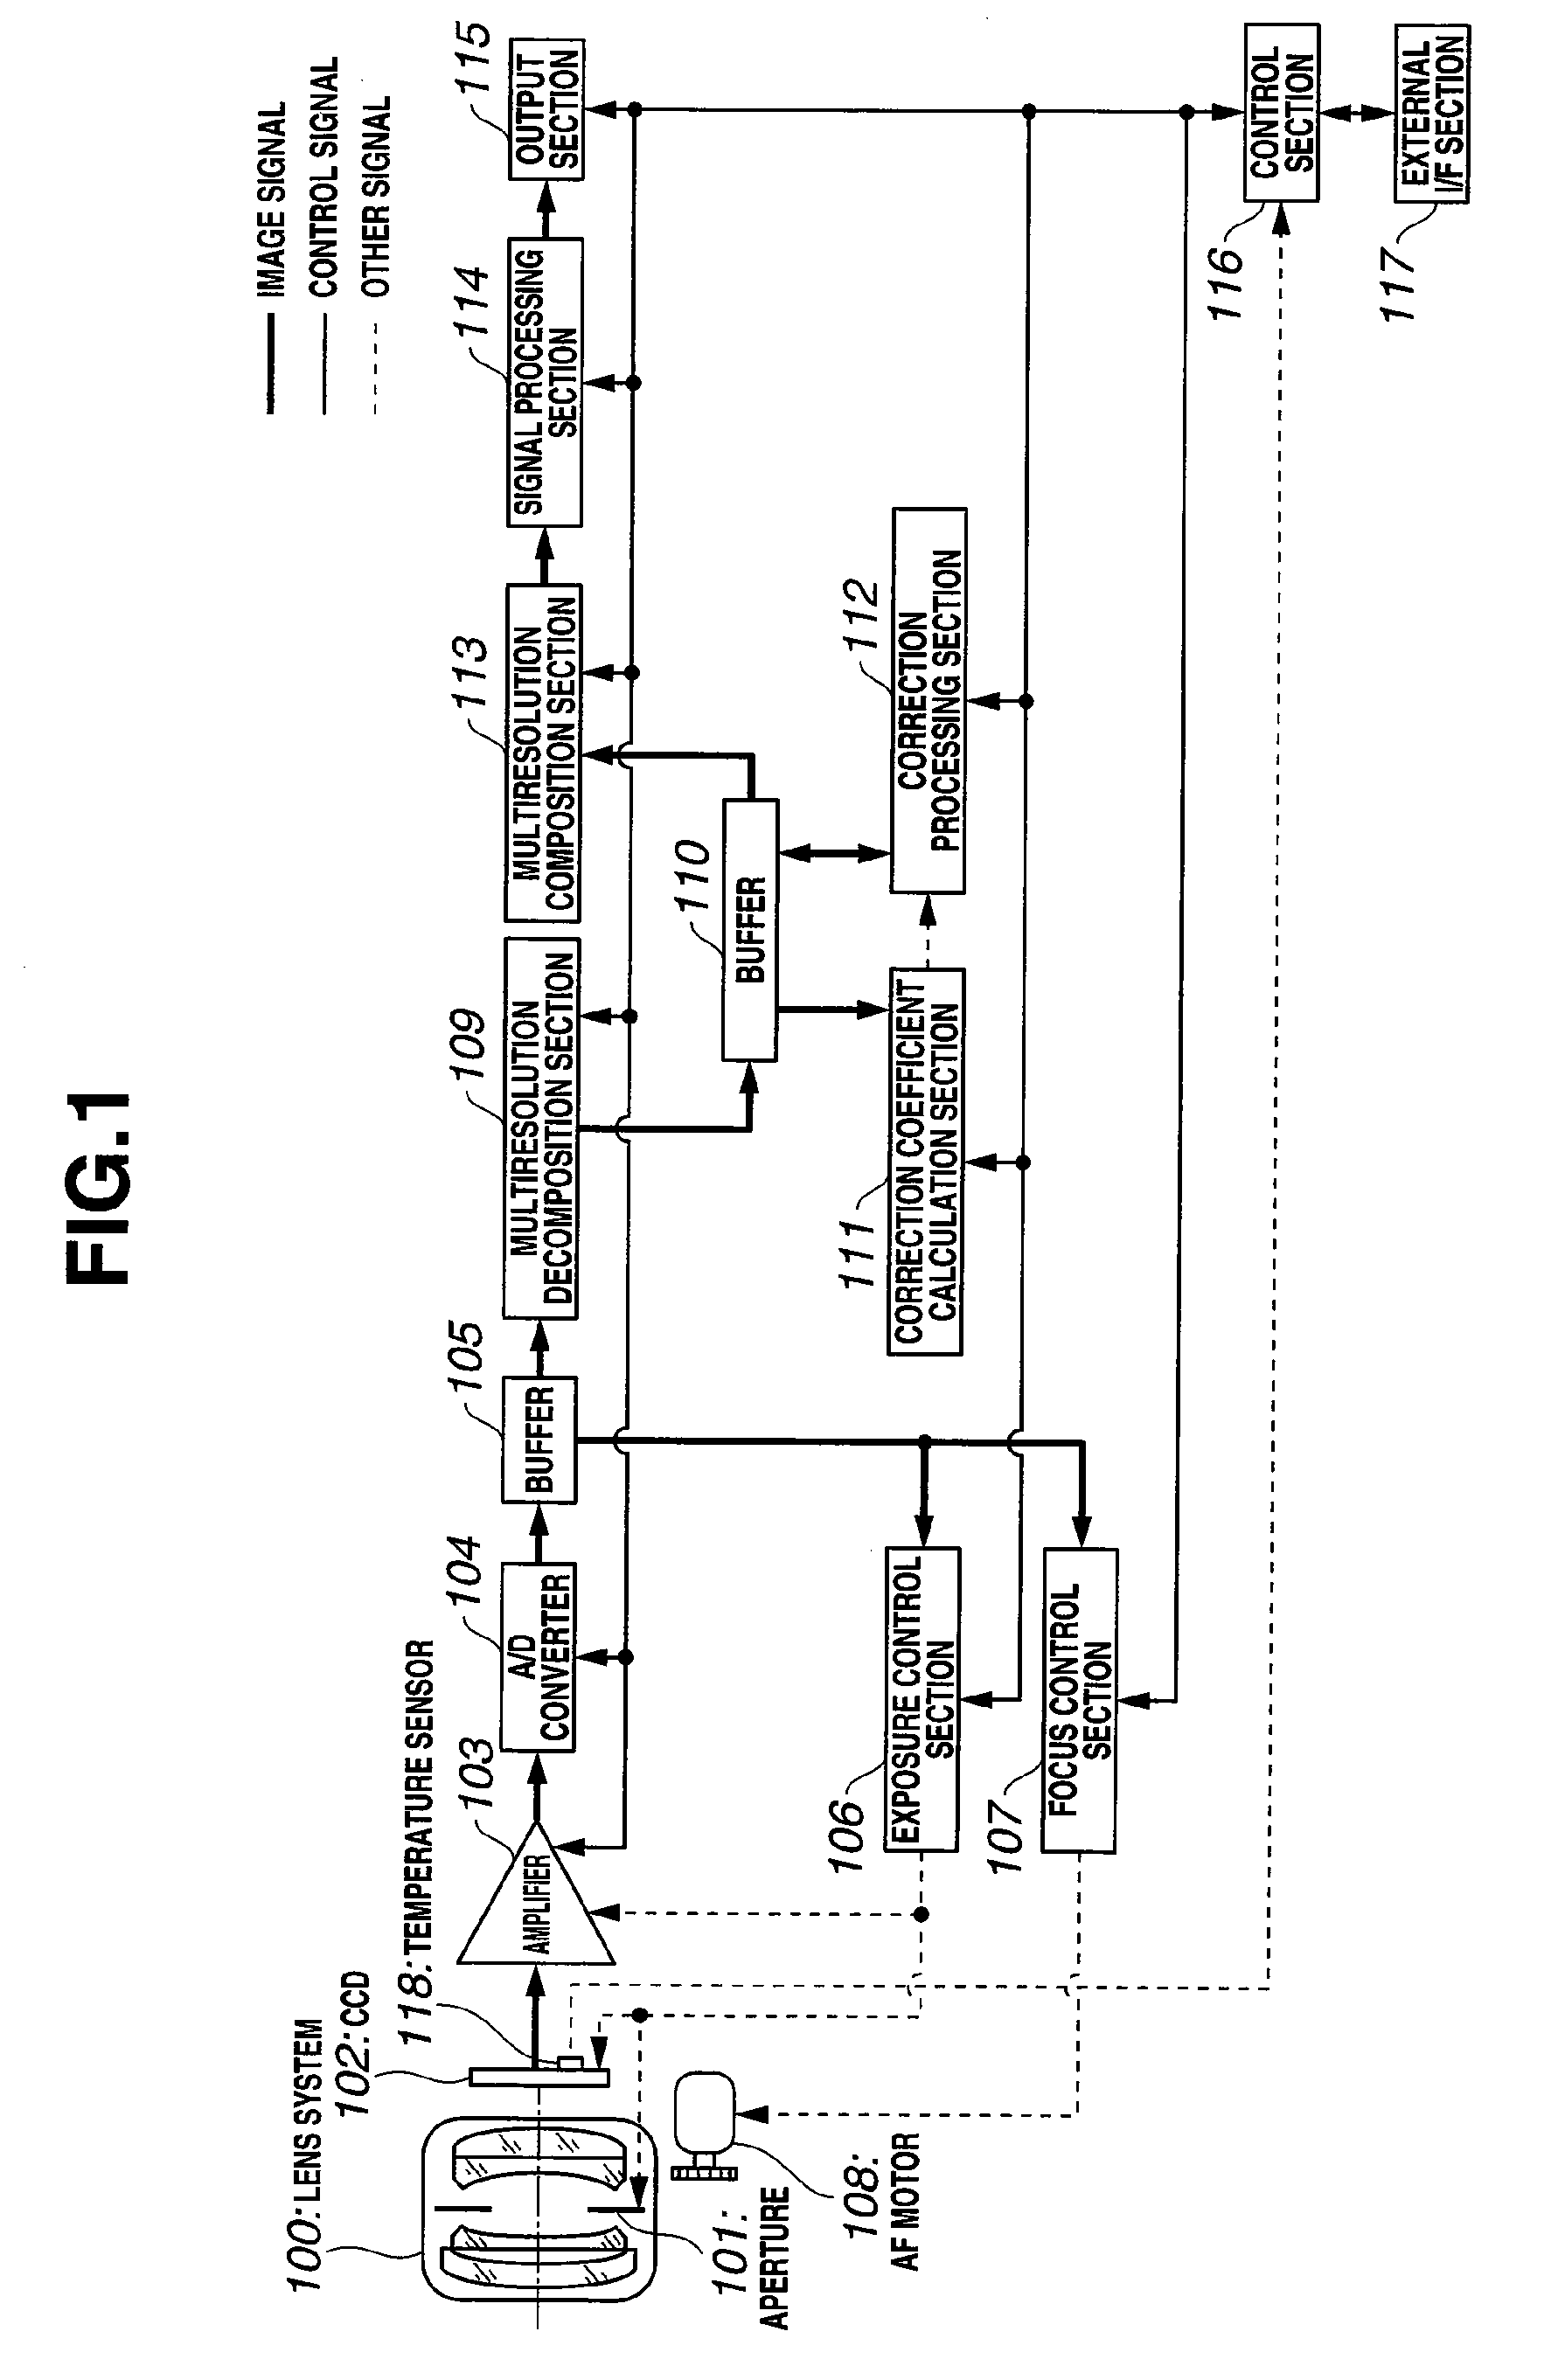
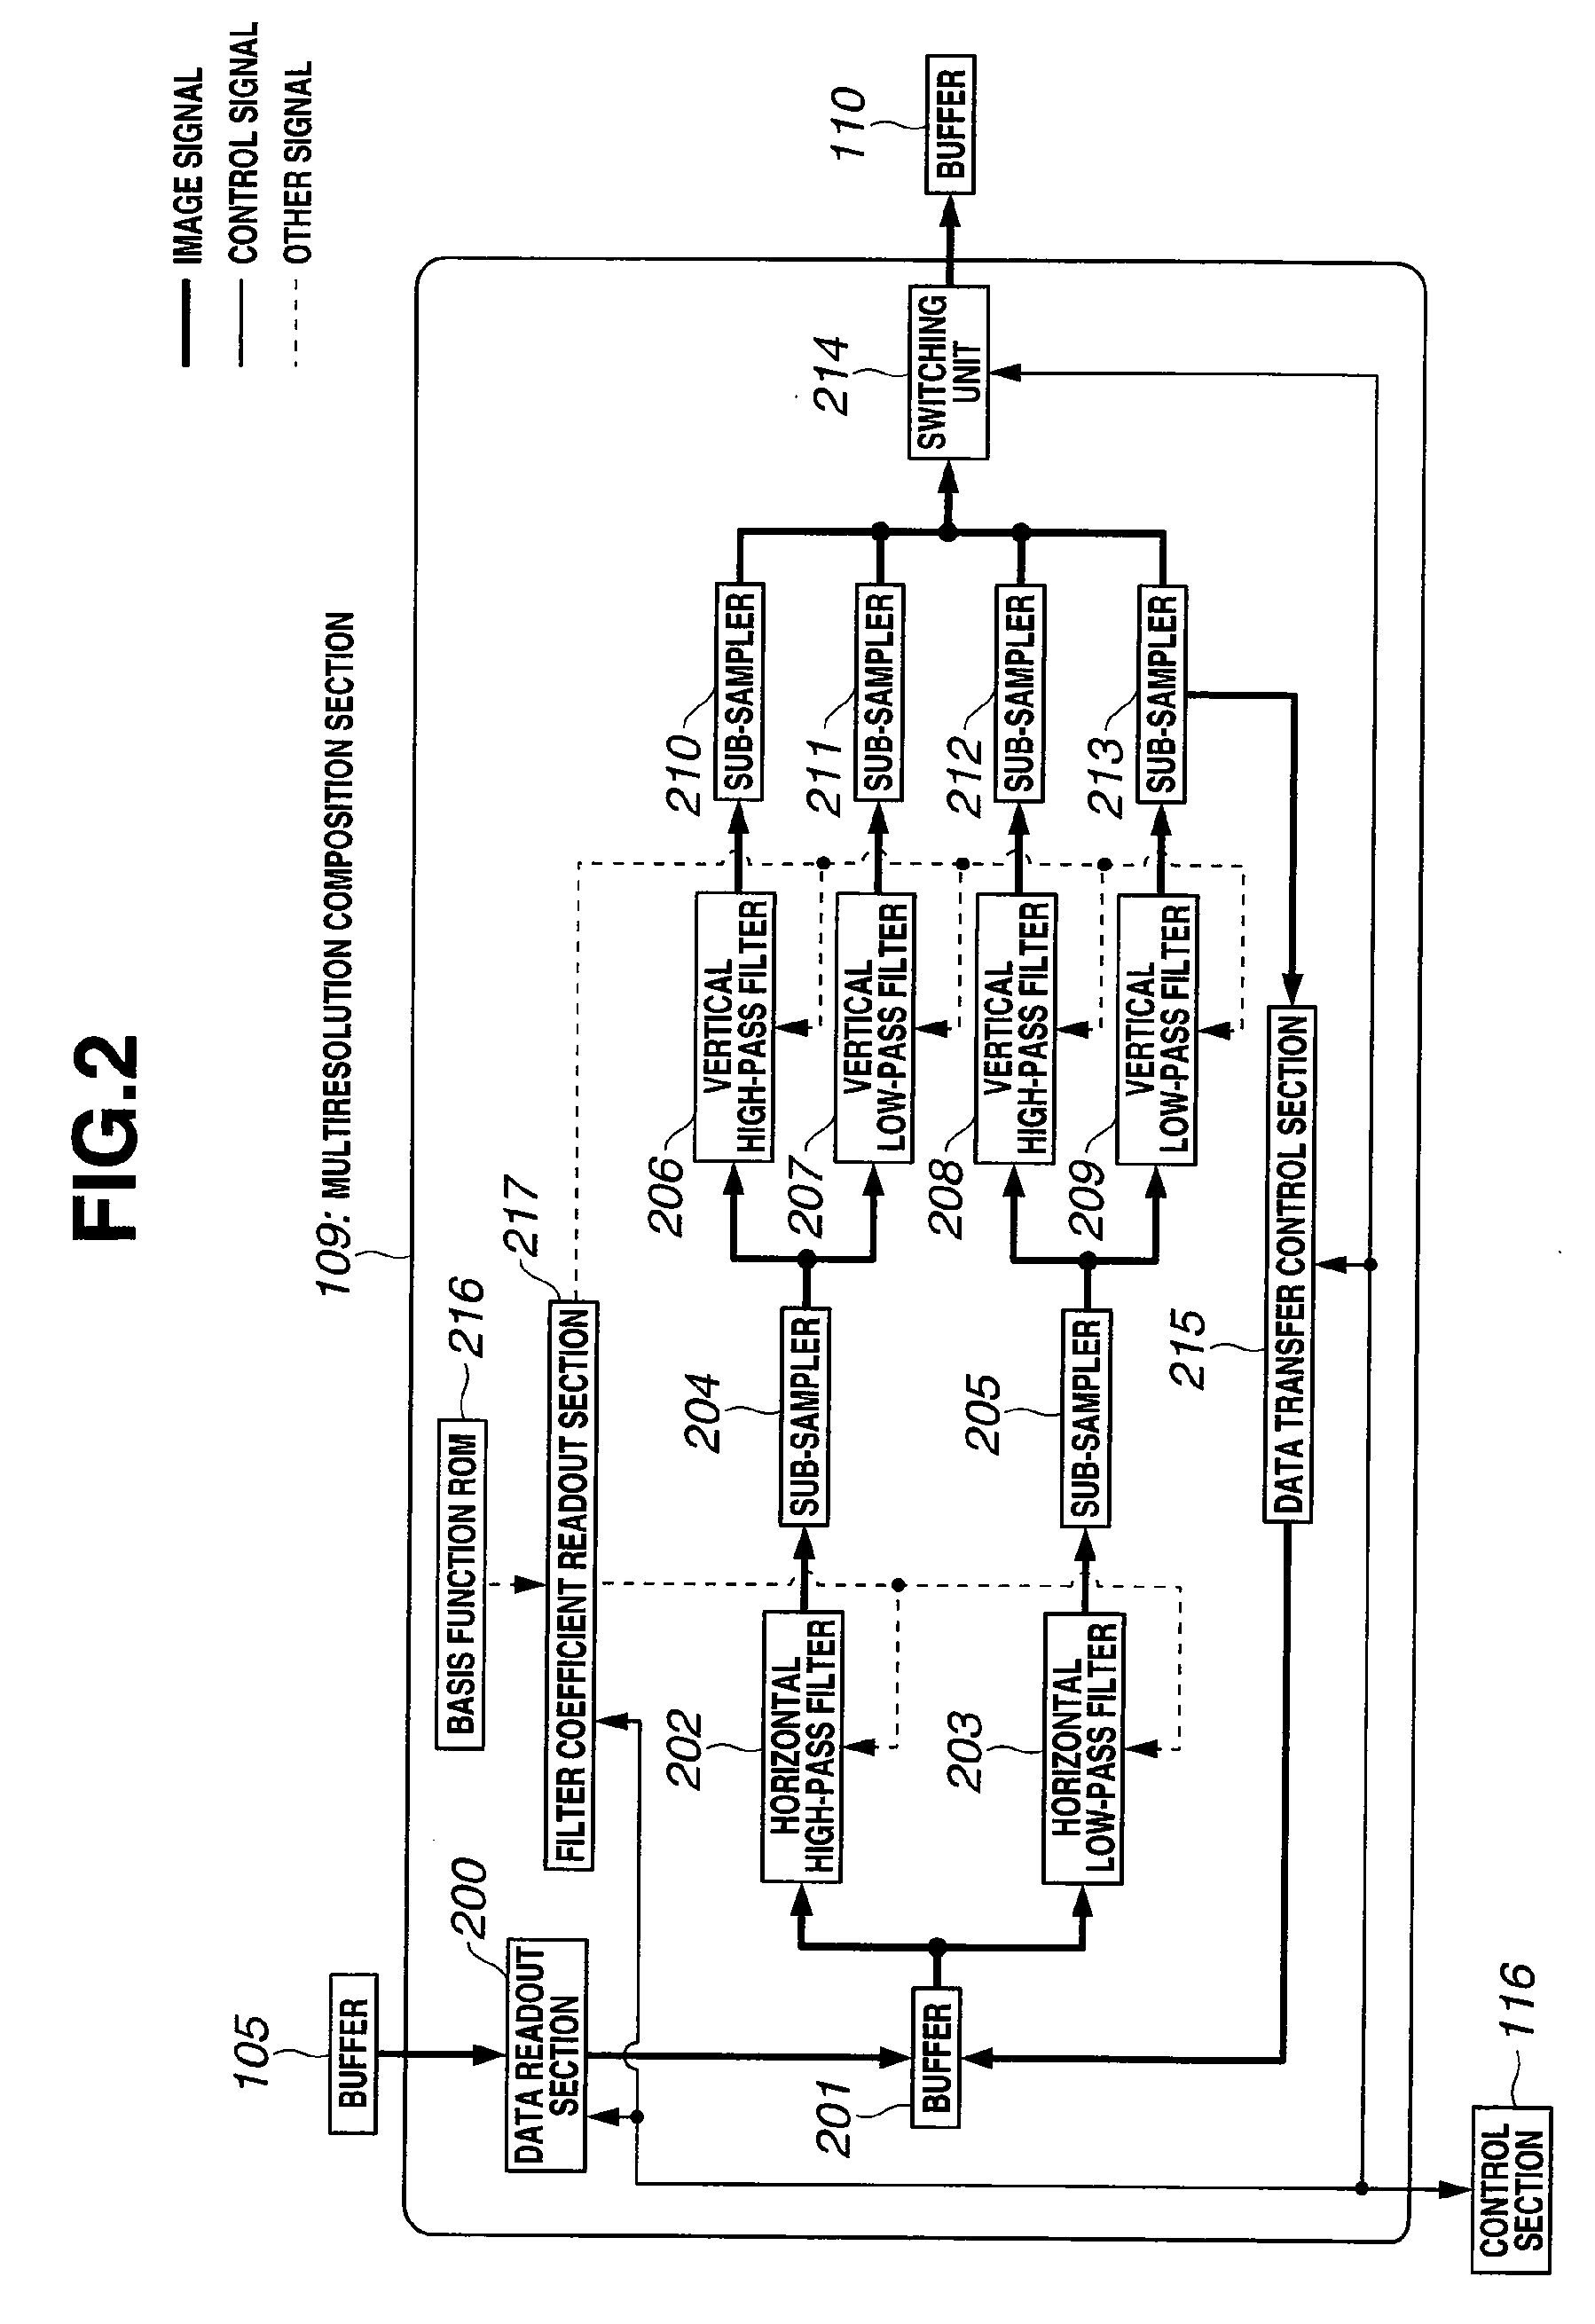
[0038]FIGS. 1 to 11 show Embodiment 1 according to the present invention. FIG. 1 is a block diagram showing a structure of an image processing system. FIG. 2 is a block diagram showing a structure of a multiresolution decomposition section. FIG. 3 is a block diagram showing a structure of a correction coefficient calculation section. FIG. 4 is a line graph showing a visual system adaptation model with respect to a gradation correction coefficient table used in the correction coefficient calculation section. FIG. 5 is a diagram showing an estimation model of a noise amount with respect to the noise correction coefficient table used in the correction coefficient calculation section. FIG. 6 is a line graph showing an edge enhancement model with respect to the edge correction coefficient table used in the correction coefficient calculation section. FIG. 7 is a block diagram showing the structure of the correction processing section. FIG. 8 is a block diagram showing the structure of a m...

embodiment 2

[0209]FIGS. 12 to 19 show Embodiment 2 according to the present invention. FIG. 12 is a block diagram showing a structure of an image processing system. FIG. 13 is an explanatory view with respect to a saturation correction in the YCbCr color space. FIG. 14 is a block diagram showing a structure of a saturation correction section. FIGS. 15A to 15G each show a line graph for explaining a maximum saturation value for each hue plane in YCbCr color space. FIG. 16 is a line graph for explaining calculation for interpolation of the maximum saturation on an intermediate hue plane. FIGS. 17A to 17G each show a line graph for explaining the maximum saturation value on each hue plane in CIE Lab color space. FIG. 18 is a flow chart showing an entire signal processing routine based on the image processing program. FIG. 19 is a flow chart showing a detail of saturation correction processing executed in step S41 shown in FIG. 18.

[0210]In Embodiment 2, the same components as those of Embodiment 1 ...


PUM


Abstract

An image processing system includes a multiresolution decomposition section for frequency decomposing an image signal into high and low frequency components at an nth stage, a correction coefficient calculation section for calculating at least one of a gradation correction coefficient, a noise correction coefficient, and an edge correction coefficient with respect to the high frequency component at an ith decomposition stage (1≦i≦n) based on at least one of the low frequency component at the ith decomposition stage, a visual system adaptation model, a noise amount estimation model, and an edge enhancement model, a correction section for correcting the high frequency component based on the calculated correction coefficient, and a multiresolution composition section for composing the image signal corrected based on the low frequency component and the corrected high frequency component.

Description

CROSS REFERENCE TO RELATED APPLICATION[0001]This application is a continuation application of PCT / JP2006 / 322472 filed on Nov. 10, 2006 and claims benefit of Japanese Application No. 2005-332010 filed in Japan on Nov. 16, 2005, the entire contents of which are incorporated herein by this reference.BACKGROUND OF THE INVENTION[0002]1. Field of the Invention[0003]The present invention relates to an image processing system, an image processing method, and a computer program product for performing a predetermined image processing with respect to an image signal.[0004]2. Description of the Related Art[0005]A space variant process for the image processing has been employed to perform the different image processing for each local region.[0006]U.S. Pat. No. 3,465,226 discloses the technology where an image signal is divided into a plurality of regions based on the texture information to obtain the gradation conversion curve based on the histogram for each region such that the weighting interp...

Claims


Application Information

Patent Timeline
Patent Type & Authority Applications(United States)
IPC IPC(8): H04N5/213H04N23/12H04N23/40
CPCG06T5/50H04N5/208H04N5/2352H04N5/243H04N5/907H04N9/8205G06T2207/20192G06T5/002G06T5/003G06T5/10G06T2207/10024G06T2207/20016G06T5/009H04N23/72H04N23/76G06T5/92G06T5/73G06T5/70
Inventor TSURUOKA, TAKAO
Owner OLYMPUS CORP
Learn More