Juices incorporating mid-season orange cultivars
- Summary
- Abstract
- Description
- Claims
- Application Information
AI Technical Summary
Benefits of technology
Problems solved by technology
Method used
Image
Examples
example 1
[0066] Polynomial trends lines for various round orange cultivar juices are plotted in FIG. 1. These trend lines are based on “overall quality” performance of juices from three categories of cultivars. Each trend line shows the variation in overall quality sensory panel scores during a growing season. The peak scores are generally evident, and the central portion of each curve represents the harvesting season for each category of cultivar. For the early-to-mid-season cultivars, including Hamlin, Pineapple, and other cultivars in this harvesting category, the harvest season runs between early October and early March, with the peak season of overall quality occurring between about mid-November and early January. For the Valencia varieties, primarily Hughes and Rhode Red Valencia cultivars, the harvesting season is shown between late December and late May, with the peak of sensory overall quality results occurring from about early February to early April. For the Vernia juice, the harv...
example 2
[0068] Pieces of round orange fruit harvested in December and January in the northern hemisphere were used in making base juices and whole juice blends. These are identified as Crop Q fruit. Juice quality analyses for each of the four base juices and juice blends for fruit harvested on December 20 are reported in Table II.
TABLE II(CROP Q)CULTIVARSVOL %BRIXACIDBARCOLORVIT CVERNIA100%10.090.8412.1337.9739.22PINEAPPLE100%9.890.8311.9136.2340.27HUGHES100%9.511.347.1036.4041.50ROHDE RED100%9.851.347.3537.7742.87VERNIA / 10%9.900.9310.6536.741.52PINEAPPLE30%10.241.397.3737.040.3060%10.010.9810.2137.641.39VERNIA / 10%9.590.9510.0936.640.70HUGHES VAL30%9.630.7113.5636.940.4160%9.790.6714.6137.340.19VERNIA / 10%9.720.8910.9238.041.88ROHDE RED30%9.881.158.5938.141.5160%9.921.198.3438.140.73
[0069] Fruit of each of these cultivars having a January 19 harvest date were subjected to juice quality analysis. The Brix values were as follows: Vernia, 10.58°; Pineapple, 11.03°; Hughes Valencia, 10.22°; an...
example 3
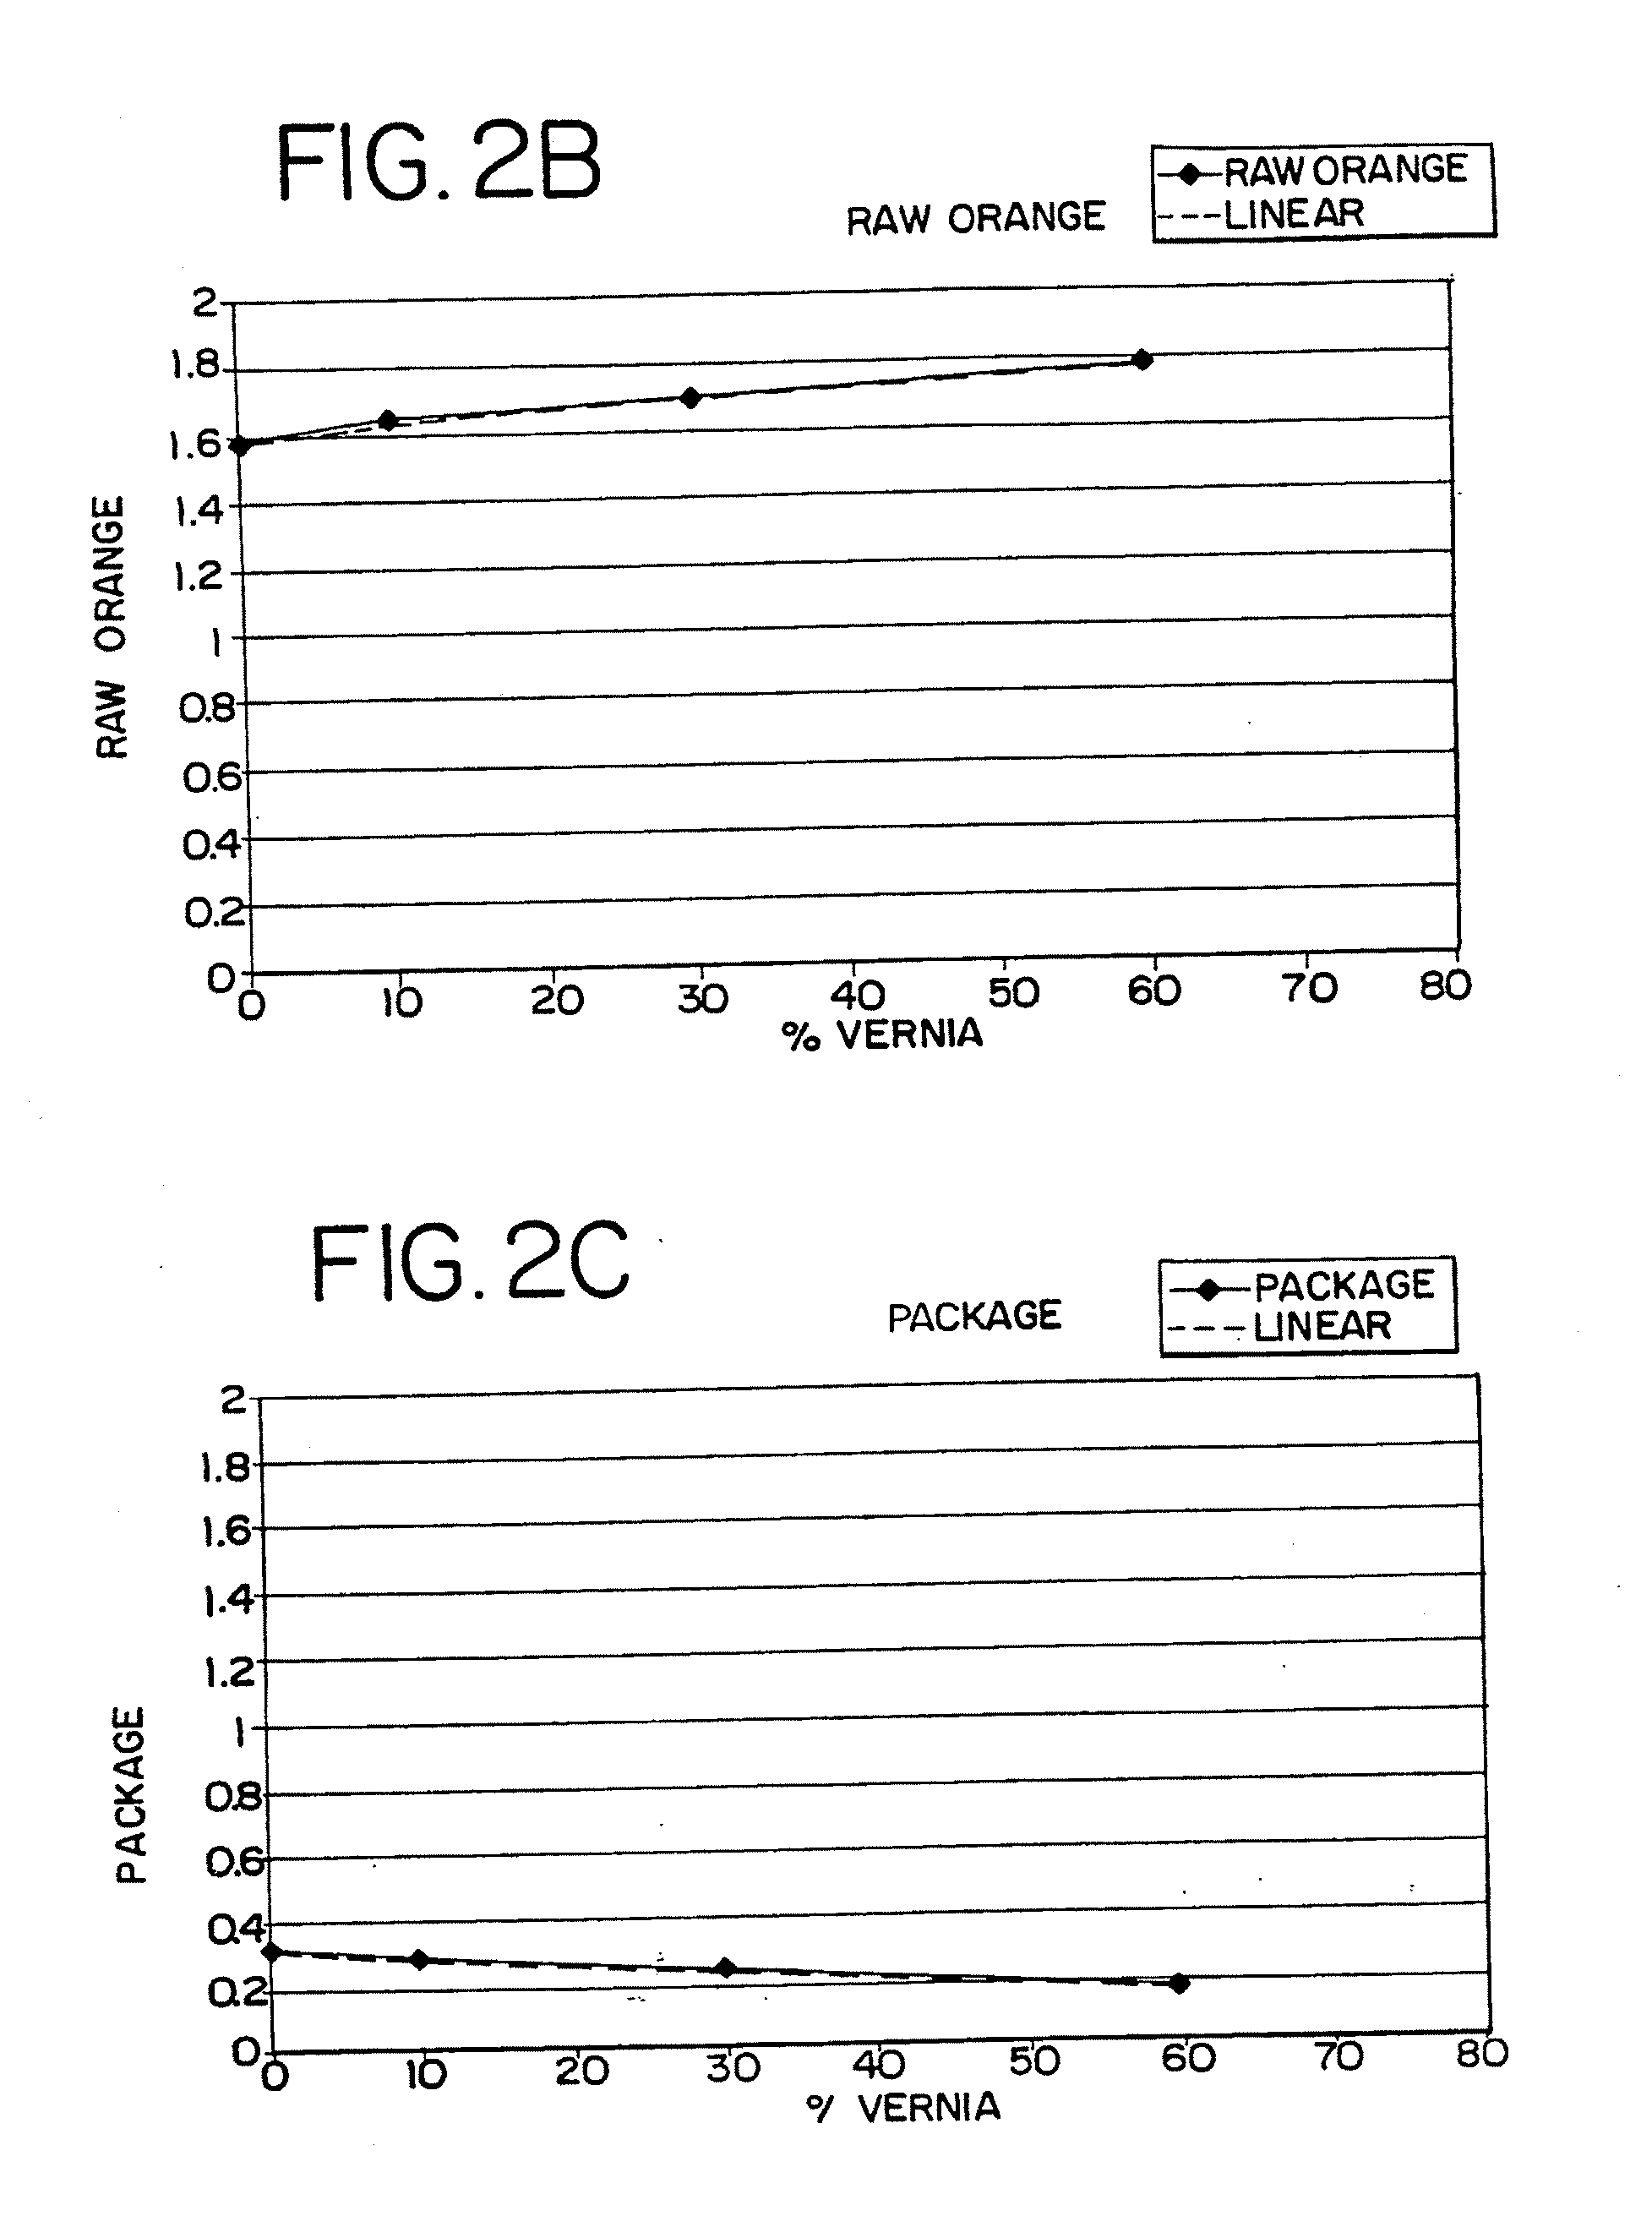
[0070] Juice quality analyses for the blends shown in Table II were conducted for varying levels of the Vernia juice blended with the Pineapple cultivar juice. The blends were no Vernia juice, 10 volume percent Vernia juice, 30 volume percent Vernia juice and 60 volume percent Vernia juice. Sweetness data are plotted in FIG. 2A. The numerical value on the sweetness scale was 3.7 for the first three blends. For the blend containing 60% Vernia, the sweetness value was 4.0, leading to the conclusion that the addition of at least 60% Vemia juice significantly increased sweetness when compared with the 100% pineapple juice. The P-value was 0.01.
[0071] Another sensory quality evaluated by the sensory panel using the descriptive sensory analysis was raw orange, the results being shown in FIG. 2B. This sensory quality increased from 1.6 for the pineapple cultivar juice having no Vernia juice to 1.8 for the whole juice blend having 60% Vernia juice. For the package flavor note, a decrease w...
PUM
 Abstract
Description
Claims
Application Information
 - R&D
- Intellectual Property
- Life Sciences
- Materials
- Tech Scout
- Unparalleled Data Quality
- Higher Quality Content
- 60% Fewer Hallucinations
Browse by: Latest US Patents, China's latest patents, Technical Efficacy Thesaurus, Application Domain, Technology Topic, Popular Technical Reports.
© 2025 PatSnap. All rights reserved.Legal|Privacy policy|Modern Slavery Act Transparency Statement|Sitemap|About US| Contact US: help@patsnap.com


