System, method, and computer program product using a database in a computing system to compile and compare metabolomic data obtained from a plurality of samples

Active Publication Date: 2007-02-08
METABOLON
View PDF11 Cites 8 Cited by
  • Summary
  • Abstract
  • Description
  • Claims
  • Application Information

AI Technical Summary

Benefits of technology

[0010] The needs outlined above are met by the present invention which, in various embodiments, also provides a system that overcomes many of the technical problems discussed above, as well other technical problems, with regard to the automated compilation, translation, and concise display of metabolomic data by conventional spectrometry data analysis systems. Specifically, in one embodiment, the system of the present invention compiles and compares 
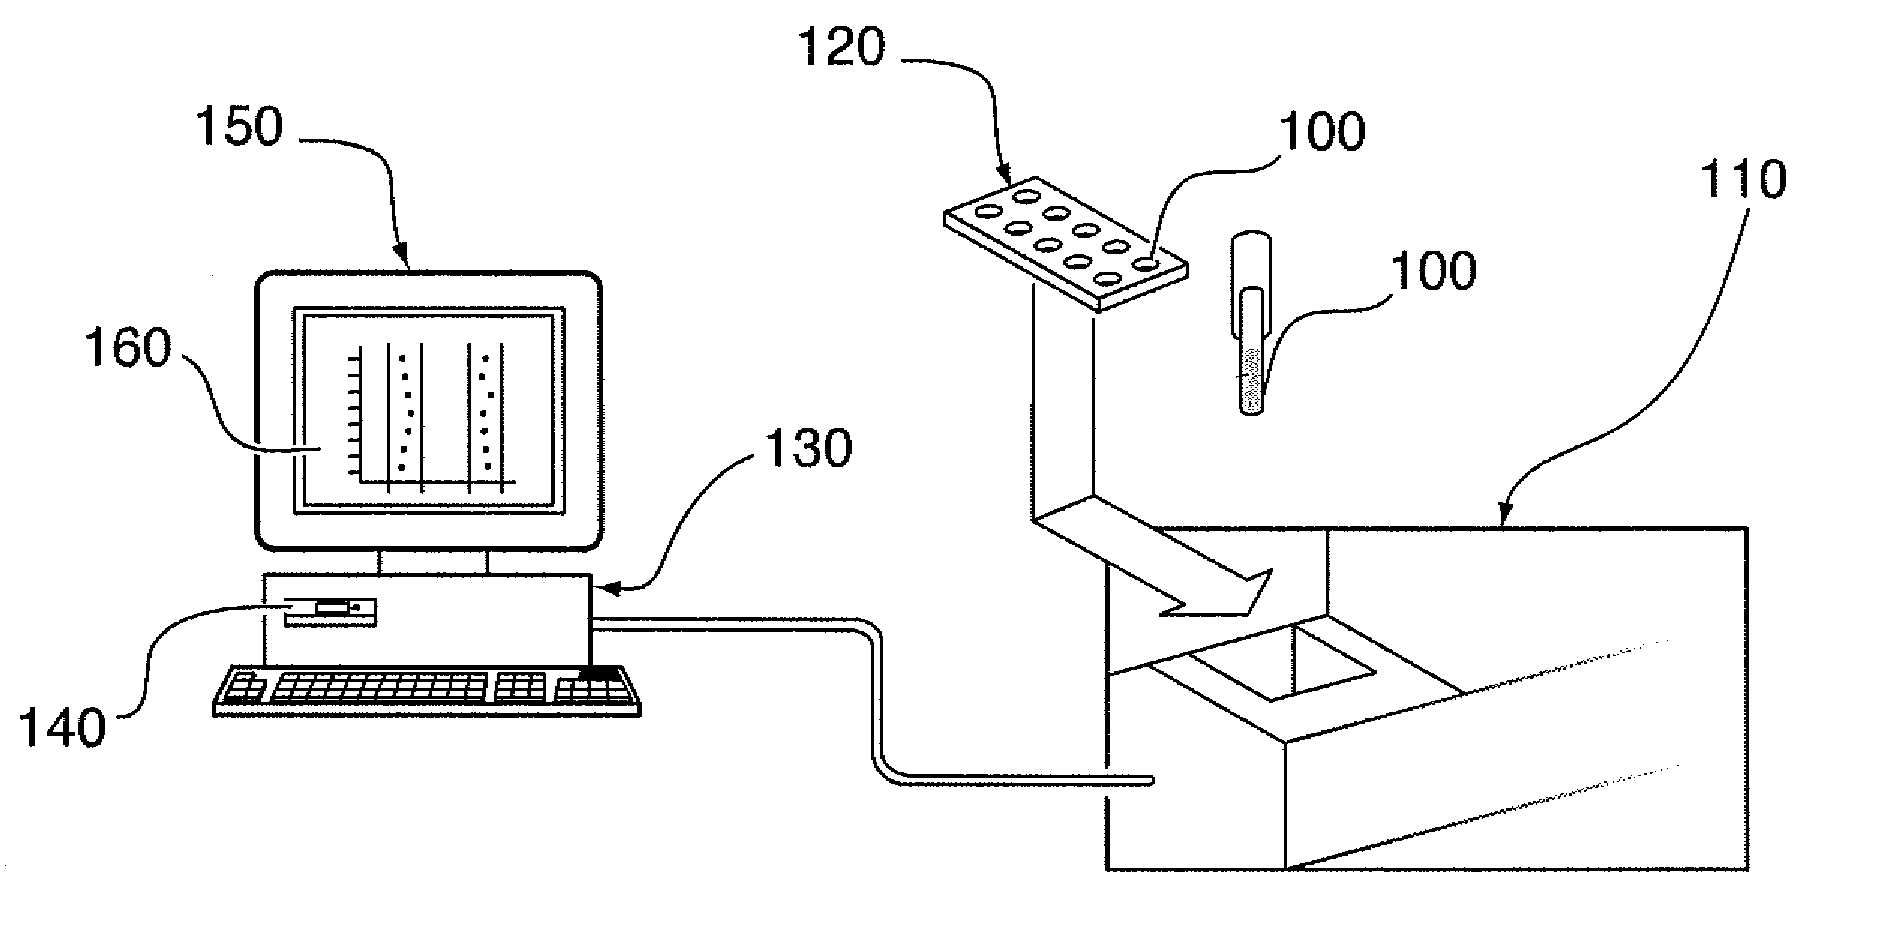
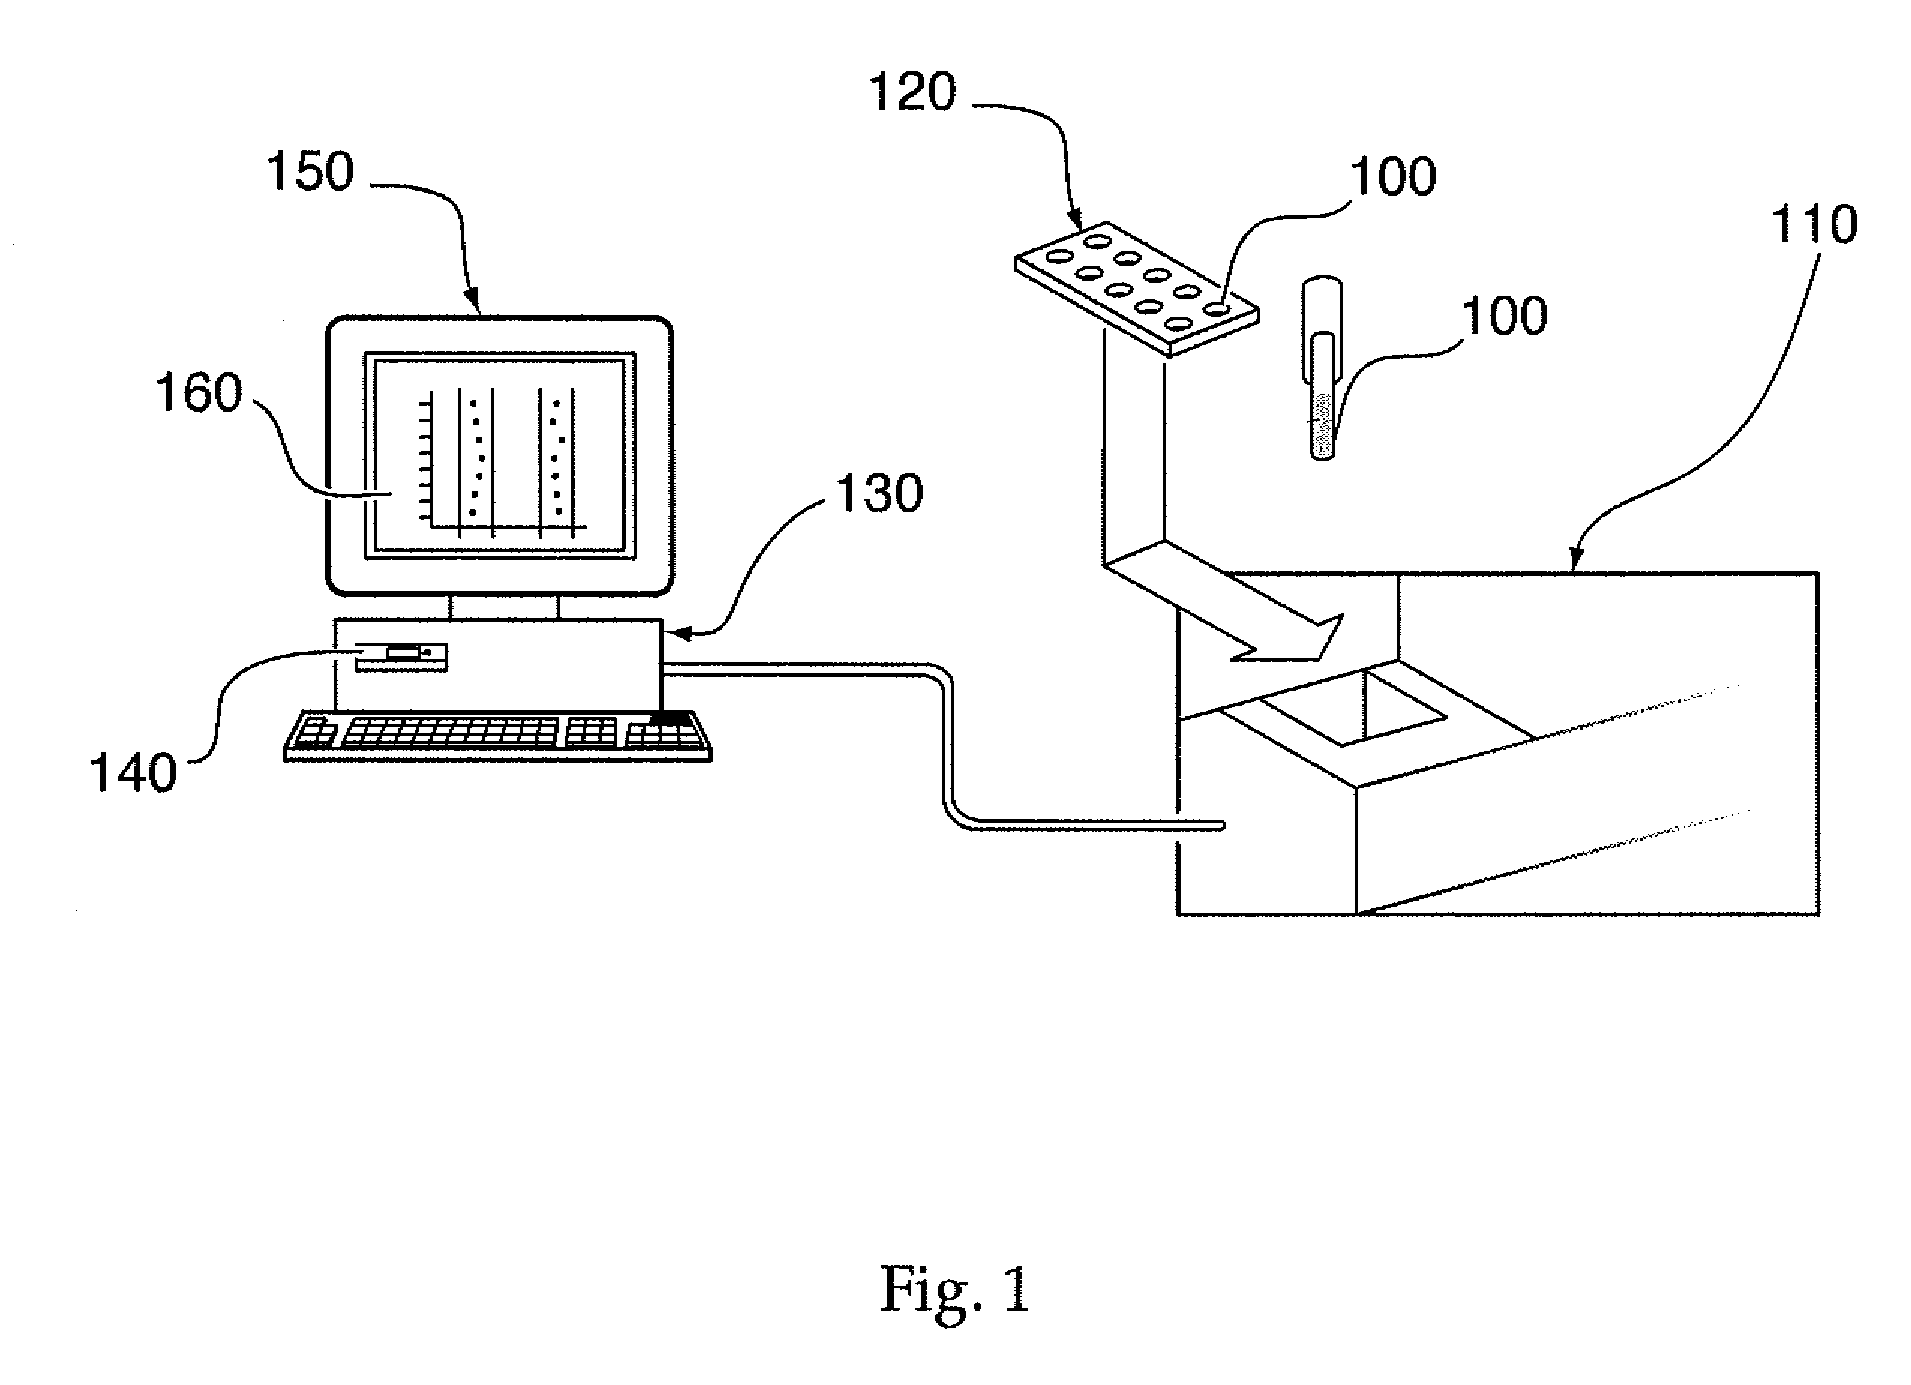
metabolomics data received from a analytical device (such as a mass spectrometer) across a plurality of samples in a manner that reduces the burden on computing systems and takes into account metabolomic variance across a sample population. In one embodiment, the system comprises a 
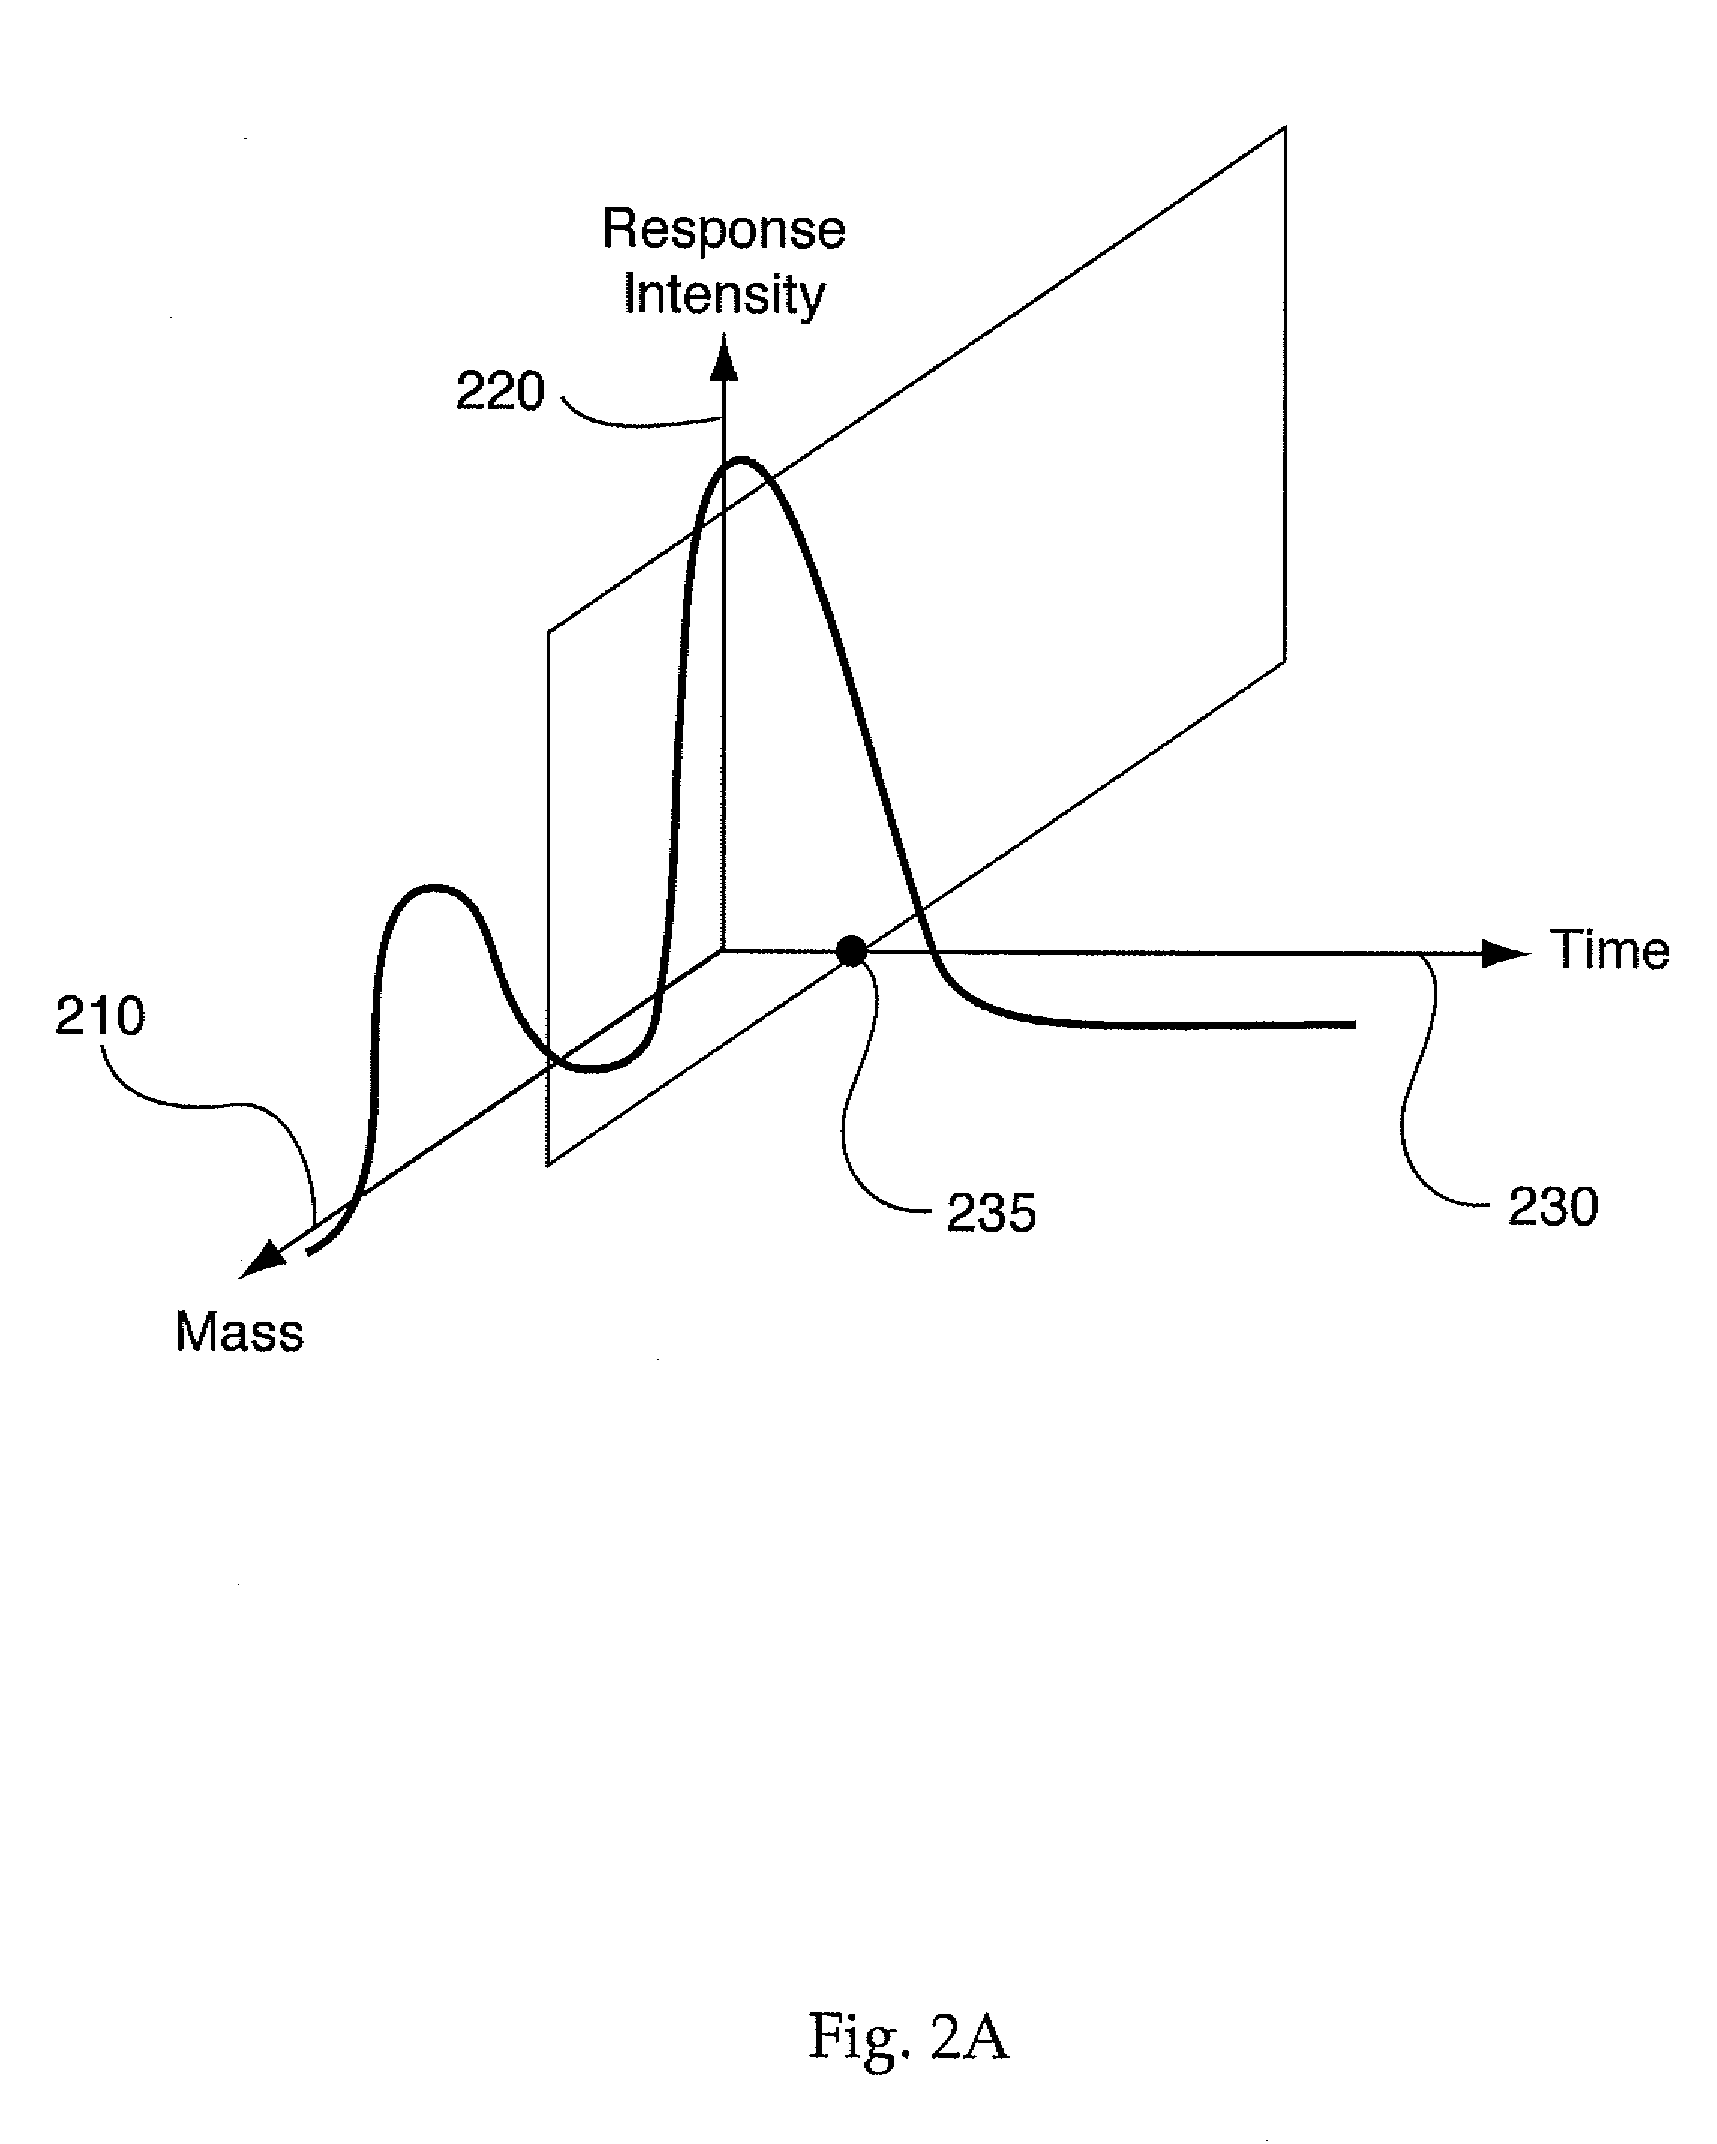
database in communication with the analytical device for automatically receiving a three-dimensional spectrometry data set corresponding to each of the plurality of samples. A processor device, in communication with the database, may be capable of converting the data set into a corresponding two-dimensional data set and subsequently and / or concurrently plotting the two-dimensional data set. Furthermore, the processor device may also compare the plotted two-dimensional data set to a plurality of characteristic plots corresponding to a plurality of selected metabolites so as to screen the plurality of samples for a presence of the plurality of selected metabolites. According to some embodiments, the system may further comprise a user interface in communication with the database and / or the processor device for displaying a visual indication of the presence of the selected metabolites across the plurality of samples in a succinct graphical format such that a user may subjectively view data from a plurality of samples.
[0012] Further, the present invention also provides methods and / or computer program products for compiling and comparing metabolomics data across a plurality of samples in a manner that reduces the burden on a computing system. In some embodiments, the method comprises: automatically receiving a three-dimensional spectrometry data set corresponding to each of the plurality of samples in a database; converting the data set into a corresponding two-dimensional data set; plotting the two-dimensional data set; comparing the plotted two-dimensional data set to a plurality of characteristic plots corresponding to a plurality of selected metabolites so as to screen the plurality of samples for a presence of the plurality of selected metabolites; and displaying a visual indication of the presence of the selected metabolites across the plurality of samples.
[0014] Thus the systems, methods, and computer program products for compiling and comparing metabolomics data across a plurality of samples, as described in the embodiments of the present invention, provide many advantages that may include, but are not limited to: automatically compiling and indexing complex three-dimensional spectrometry data sets for a plurality of biological samples so as to be capable of generating a sample population data set; converting the complex three dimensional data sets into two dimensional data sets and corresponding data plots that are more easily comparable to a library of data plots corresponding to a plurality of selected metabolites of interest; providing a graphical representation of the spectrometry data analyses used to identify metabolites of interest; and providing a graphical representation of the compiled data across a population of biological samples such that the user of the system of the present invention may subjectively evaluate the spectrometry data and evaluate only those samples exhibiting a variance that may be indicative of the absence and / or presence of a selected metabolite without the need for opening a plurality of individual data files corresponding to each particular biological sample under examination.
[0015] These advantages and others that will be evident to those skilled in the art are provided in the system, method, and computer program product of the present invention. Importantly, all of these advantages allow the system to display metabolomic analysis results to a user in a compact format that spans a “fourth dimension” across the population of biological samples. Because, analytical results data spanning across the sample population is made more readily evident to the user in a graphical format, along with the identification of metabolites of interest as potential disease targets, the user is better able to determine the presence and / or absence of selected metabolites and / or chemical components within the samples. Furthermore, because additional sample population data is provided, the embodiments of the present invention are less likely to discount potentially valuable spectrometry results that may be discounted when viewed independently from the sample population.

Problems solved by technology

While genomics (study of the DNA-level biochemistry), transcript profiling (study of the RNA-level biochemistry), and proteomics (study of the protein-level biochemistry) are useful for identification of disease pathways, these methods are complicated by the fact that there exist over 25,000 genes, 100,000 to 200,000 RNA transcripts and up to 1,000,000 proteins in human cells.
However, the collection and sorting of metabolomic data taken from a variety of biological samples (e.g., from a patient population) consumes large amounts of time and computational power.
However, conventional “file-based” methods (referring to the data file generated for each biological sample) require the use of large amounts of computing power and memory assets to handle the screening of large numbers of known metabolites.
Furthermore, “file-based” data handling does not lend itself to the compilation of sample population data across a number of samples because, according to known metabolomic data handling techniques, each sample is analyzed independently, without taking into account subtle changes in metabolite composition that may be more readily detectable across a sample population.
Furthermore, existing “file-based” method have other limitations including: limited security and audit ability; poor data set consistency across multiple file copies; and individual files do not support multiple indices (example day collected, sample ID, control vs. treated, drug dose, etc) such that all files must be scanned when only a subset is desired.
These limitations in current metabolomic data analysis techniques may lead to the discarding of potentially relevant and / or valuable metabolomic data that may be used to identify and classify particular metabolites as disease targets.
However, conventional systems do not readily allow for the consolidation of spectrometry data from a number of biological samples for the subjective evaluation of the data generated by the spectrometry processes.

Method used


Image

  • System, method, and computer program product using a database in a computing system to compile and compare metabolomic data obtained from a plurality of samples
  • System, method, and computer program product using a database in a computing system to compile and compare metabolomic data obtained from a plurality of samples
  • System, method, and computer program product using a database in a computing system to compile and compare metabolomic data obtained from a plurality of samples

Examples


Embodiment Construction

[0022] The present inventions now will be described more fully hereinafter with reference to the accompanying drawings, in which some, but not all embodiments of the invention are shown. Indeed, these inventions may be embodied in many different forms and should not be construed as limited to the embodiments set forth herein; rather, these embodiments are provided so that this disclosure will satisfy applicable legal requirements. Like numbers refer to like elements throughout.

[0023] The various aspects of the present invention mentioned above, as well as many other aspects of the invention are described in greater detail below. The systems, methods, and computer program products of the present invention are described in conjunction with a mass spectrometer. It must be understood that this is only one example of the use of the present invention. Specifically, the systems, methods, and computer program products of the present invention can be adapted to any number of processes that ...


PUM


Abstract

The present invention generates a visual display of metabolomic data compiled by a database and associated processor. More particularly, the present invention provides a database for automatically receiving a three-dimensional spectrometry data set for a group of samples. The present invention also provides a processor device for manipulating the data sets to produce plots that are directly comparable to a plurality of characteristic plots corresponding to a plurality of selected metabolites. Furthermore, the processor device may generate a visual display indicating the presence of the selected metabolites across the group of samples. Thus, the present invention enables a user to analyze a series of complex data sets in a visual display that may indicate the presence of the selected metabolites across the group of samples. Furthermore, the visual display generated by embodiments of the present invention also expedites the subjective analysis of the spectrometry data sets.

Description

CROSS-REFERENCE TO RELATED APPLICATION [0001] This application claims the benefit of U.S. Provisional Application No. 60 / 706,459, filed Aug. 8, 2005, which is incorporated by reference herein in its entirety.BACKGROUND OF THE INVENTION [0002] 1. Field of the Invention [0003] The present invention relates to the field of metabolomics, which is the study of small molecules produced by an organism's metabolic processes. More particularly, the embodiments of the present invention are adapted to compile and compare metabolomic data received from a spectrometry device across a plurality of samples. Furthermore, embodiments of the present invention may also provide for the display of a visual indication of the presence of selected metabolites in each of the plurality of samples such that metabolomic data may be subjectively analyzed by a user across the plurality of samples. [0004] 2. Description of Related Art [0005] Metabolomics is the study of the small molecules, or metabolites, contai...

Claims


Application Information

Patent Timeline
IPC IPC(8): G01R15/00G16B20/00G16B45/00G16B50/30
CPCG06F19/18G06F19/28G06F19/26G16B20/00G16B45/00G16B50/00G16B50/30
Inventor BARRETT, THOMAS HENRY JR.DEHAVEN, COREY DONALDALEXANDER, DANNY C.
Owner METABOLON
Why Eureka
Try Eureka