Driver adaptive collision warning system
a collision warning and driver technology, applied in the direction of process control, process and machine control, pedestrian/occupant safety arrangement, etc., can solve the problems of false alarms, warning may be too late for conservative drivers, and severe consequences on the performance of collision warning systems
- Summary
- Abstract
- Description
- Claims
- Application Information
AI Technical Summary
Benefits of technology
Problems solved by technology
Method used
Image
Examples
example 1
Driver Model Creation and Determination of Values of PMs
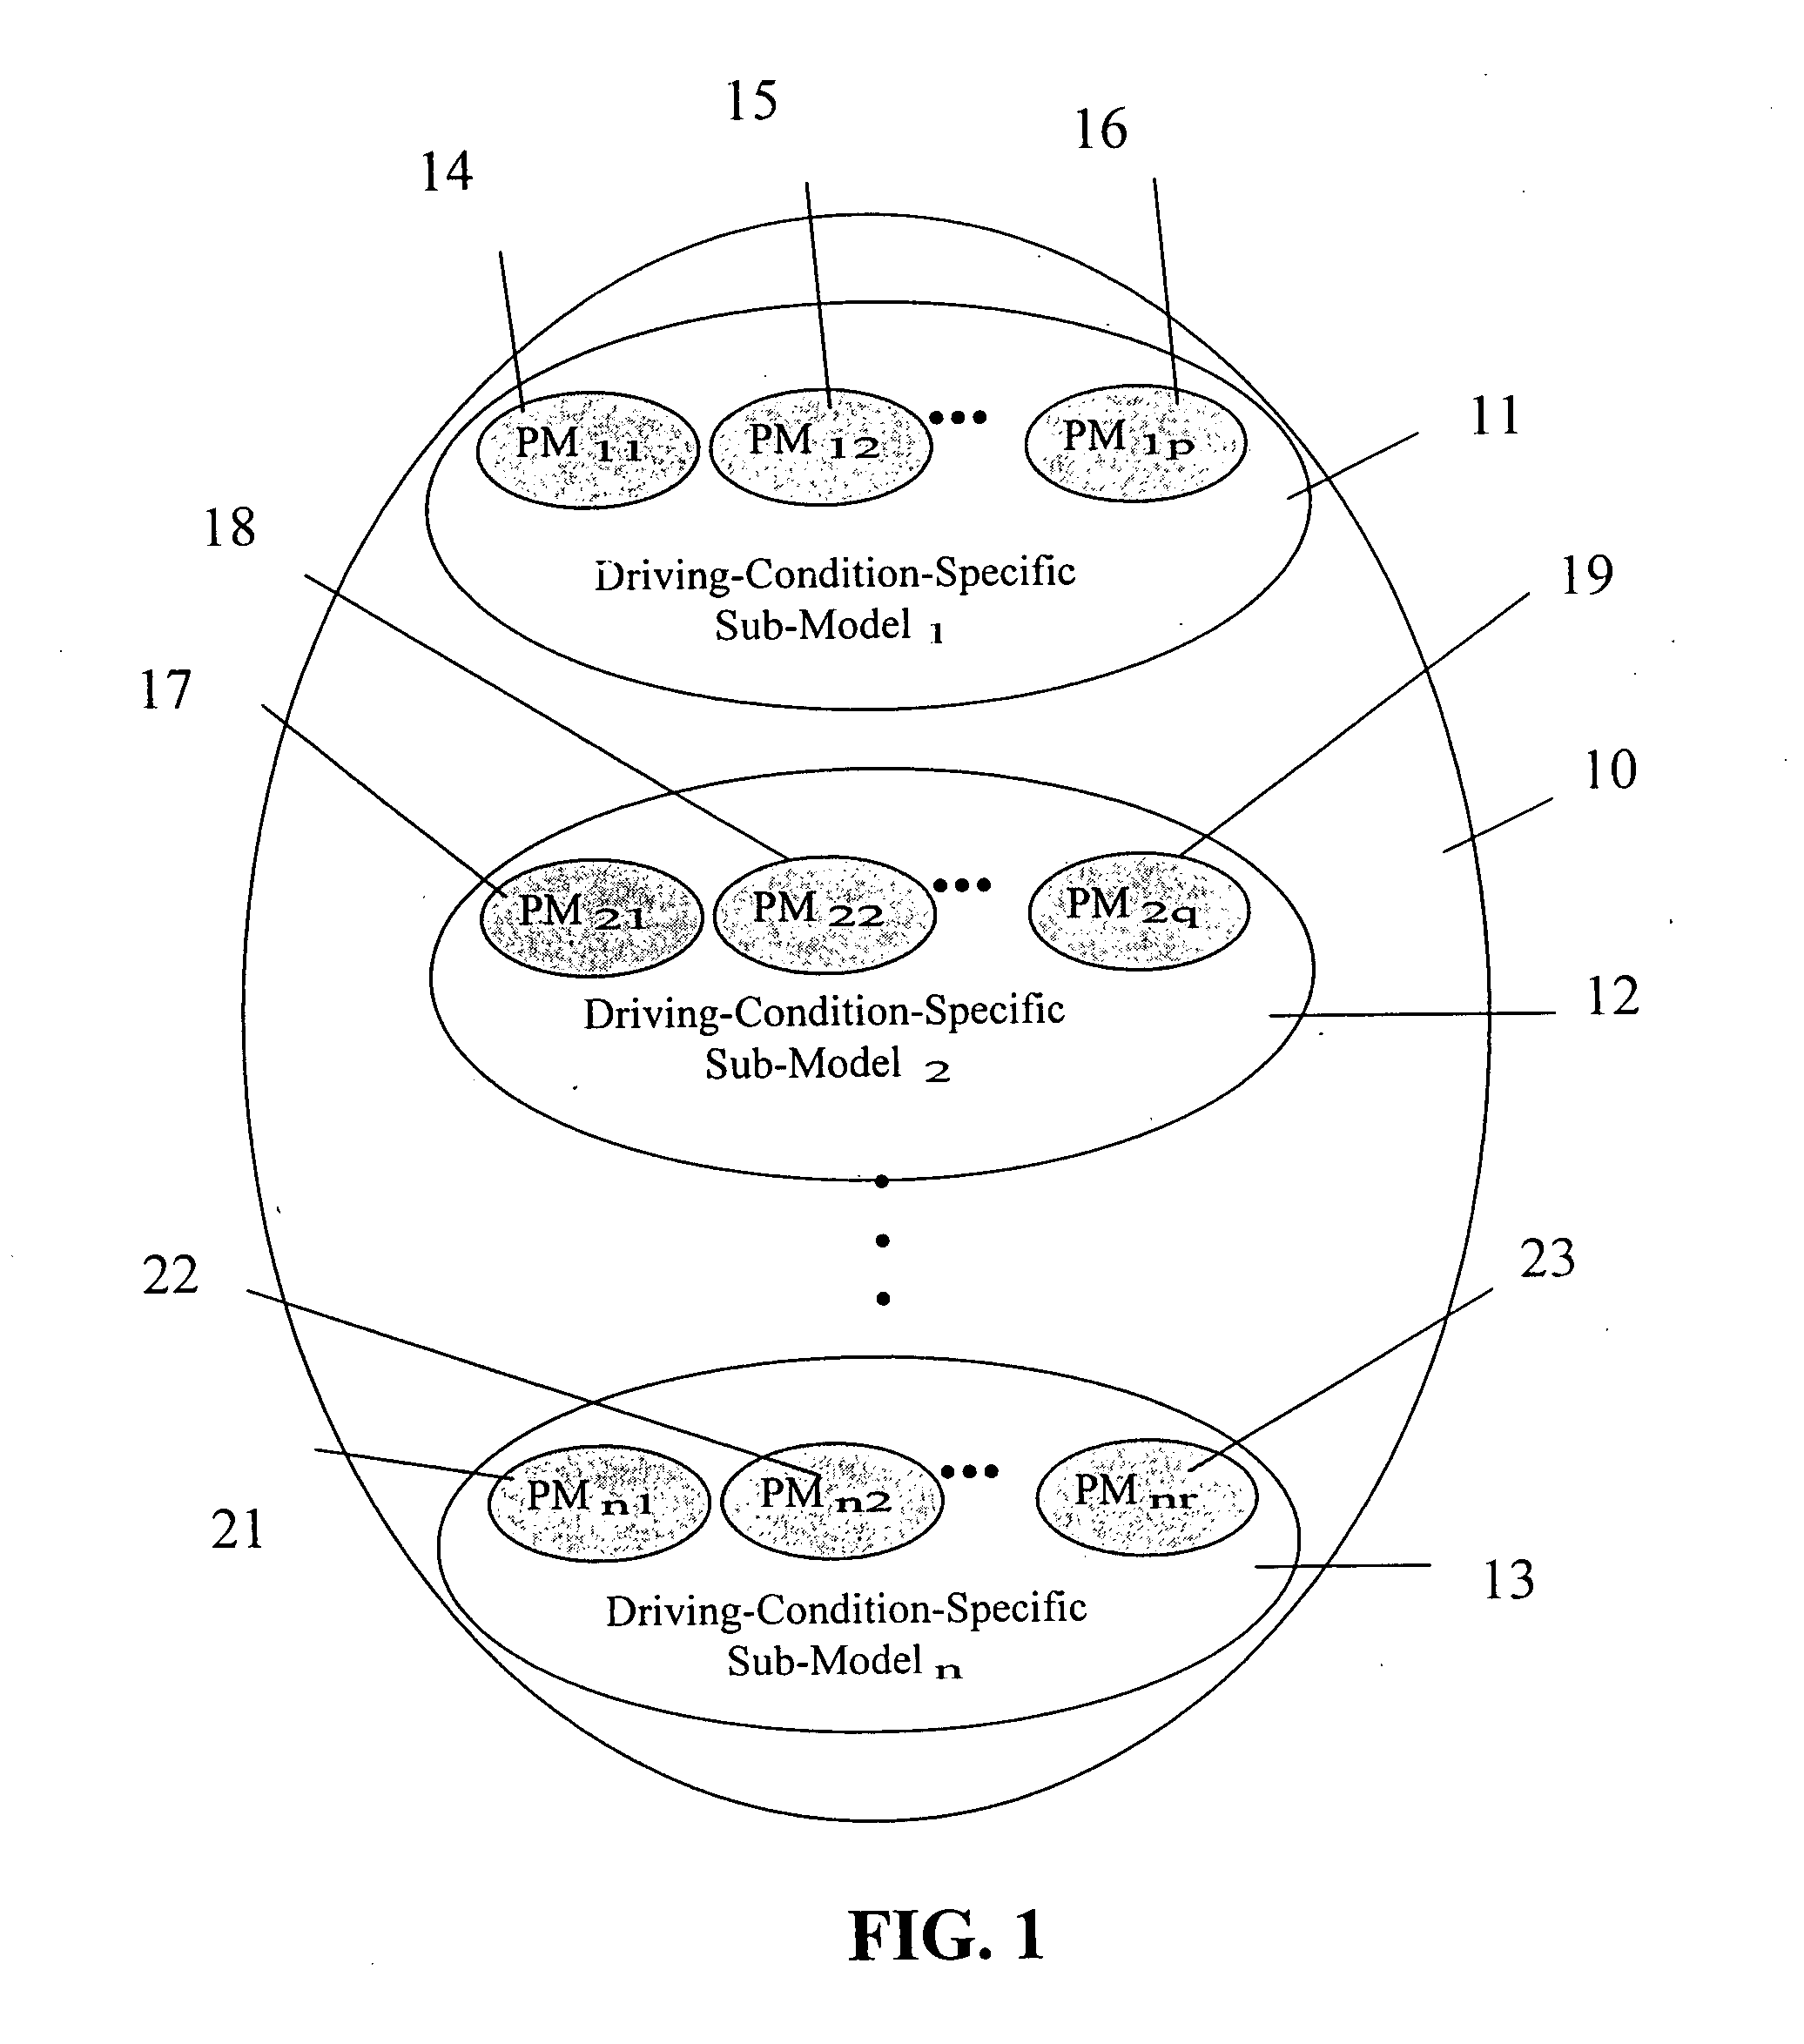
Experiments were performed using two drivers A and B. Raw driving data related to hostv, host_acc, and Tares PMs, as described hereinabove were collected from the two drivers. Additionally, four artificial driver models C, D, E, F were also created from the data collected from the real driver A. Table. 4 explains how the data in these artificial driver models were simulated. It should be noted that each driver model contained all three PMs.
TABLE 4Artificial drivers and how their data were simulatedArtificialDriverHow to simulate dataCReduce hostv by 10% andincrease range by 10% on Driver A's dataDReduce hostv by 15% andincrease range by 20% on Driver A's dataEIncrease hostv by 5% andreduce range by 40% on Driver A's dataFIncrease hostv by 5% andreduce range by 20% on Driver A's data
Once the raw data were collected, they were processed by applying appropriate pre-determined algorithm corresponding to each PM, as described h...
example 2
Driver Attitude Determination
The overall driver attitude level was determined according to the following steps:
Step (1): Obtaining an Average Value of Each PM.
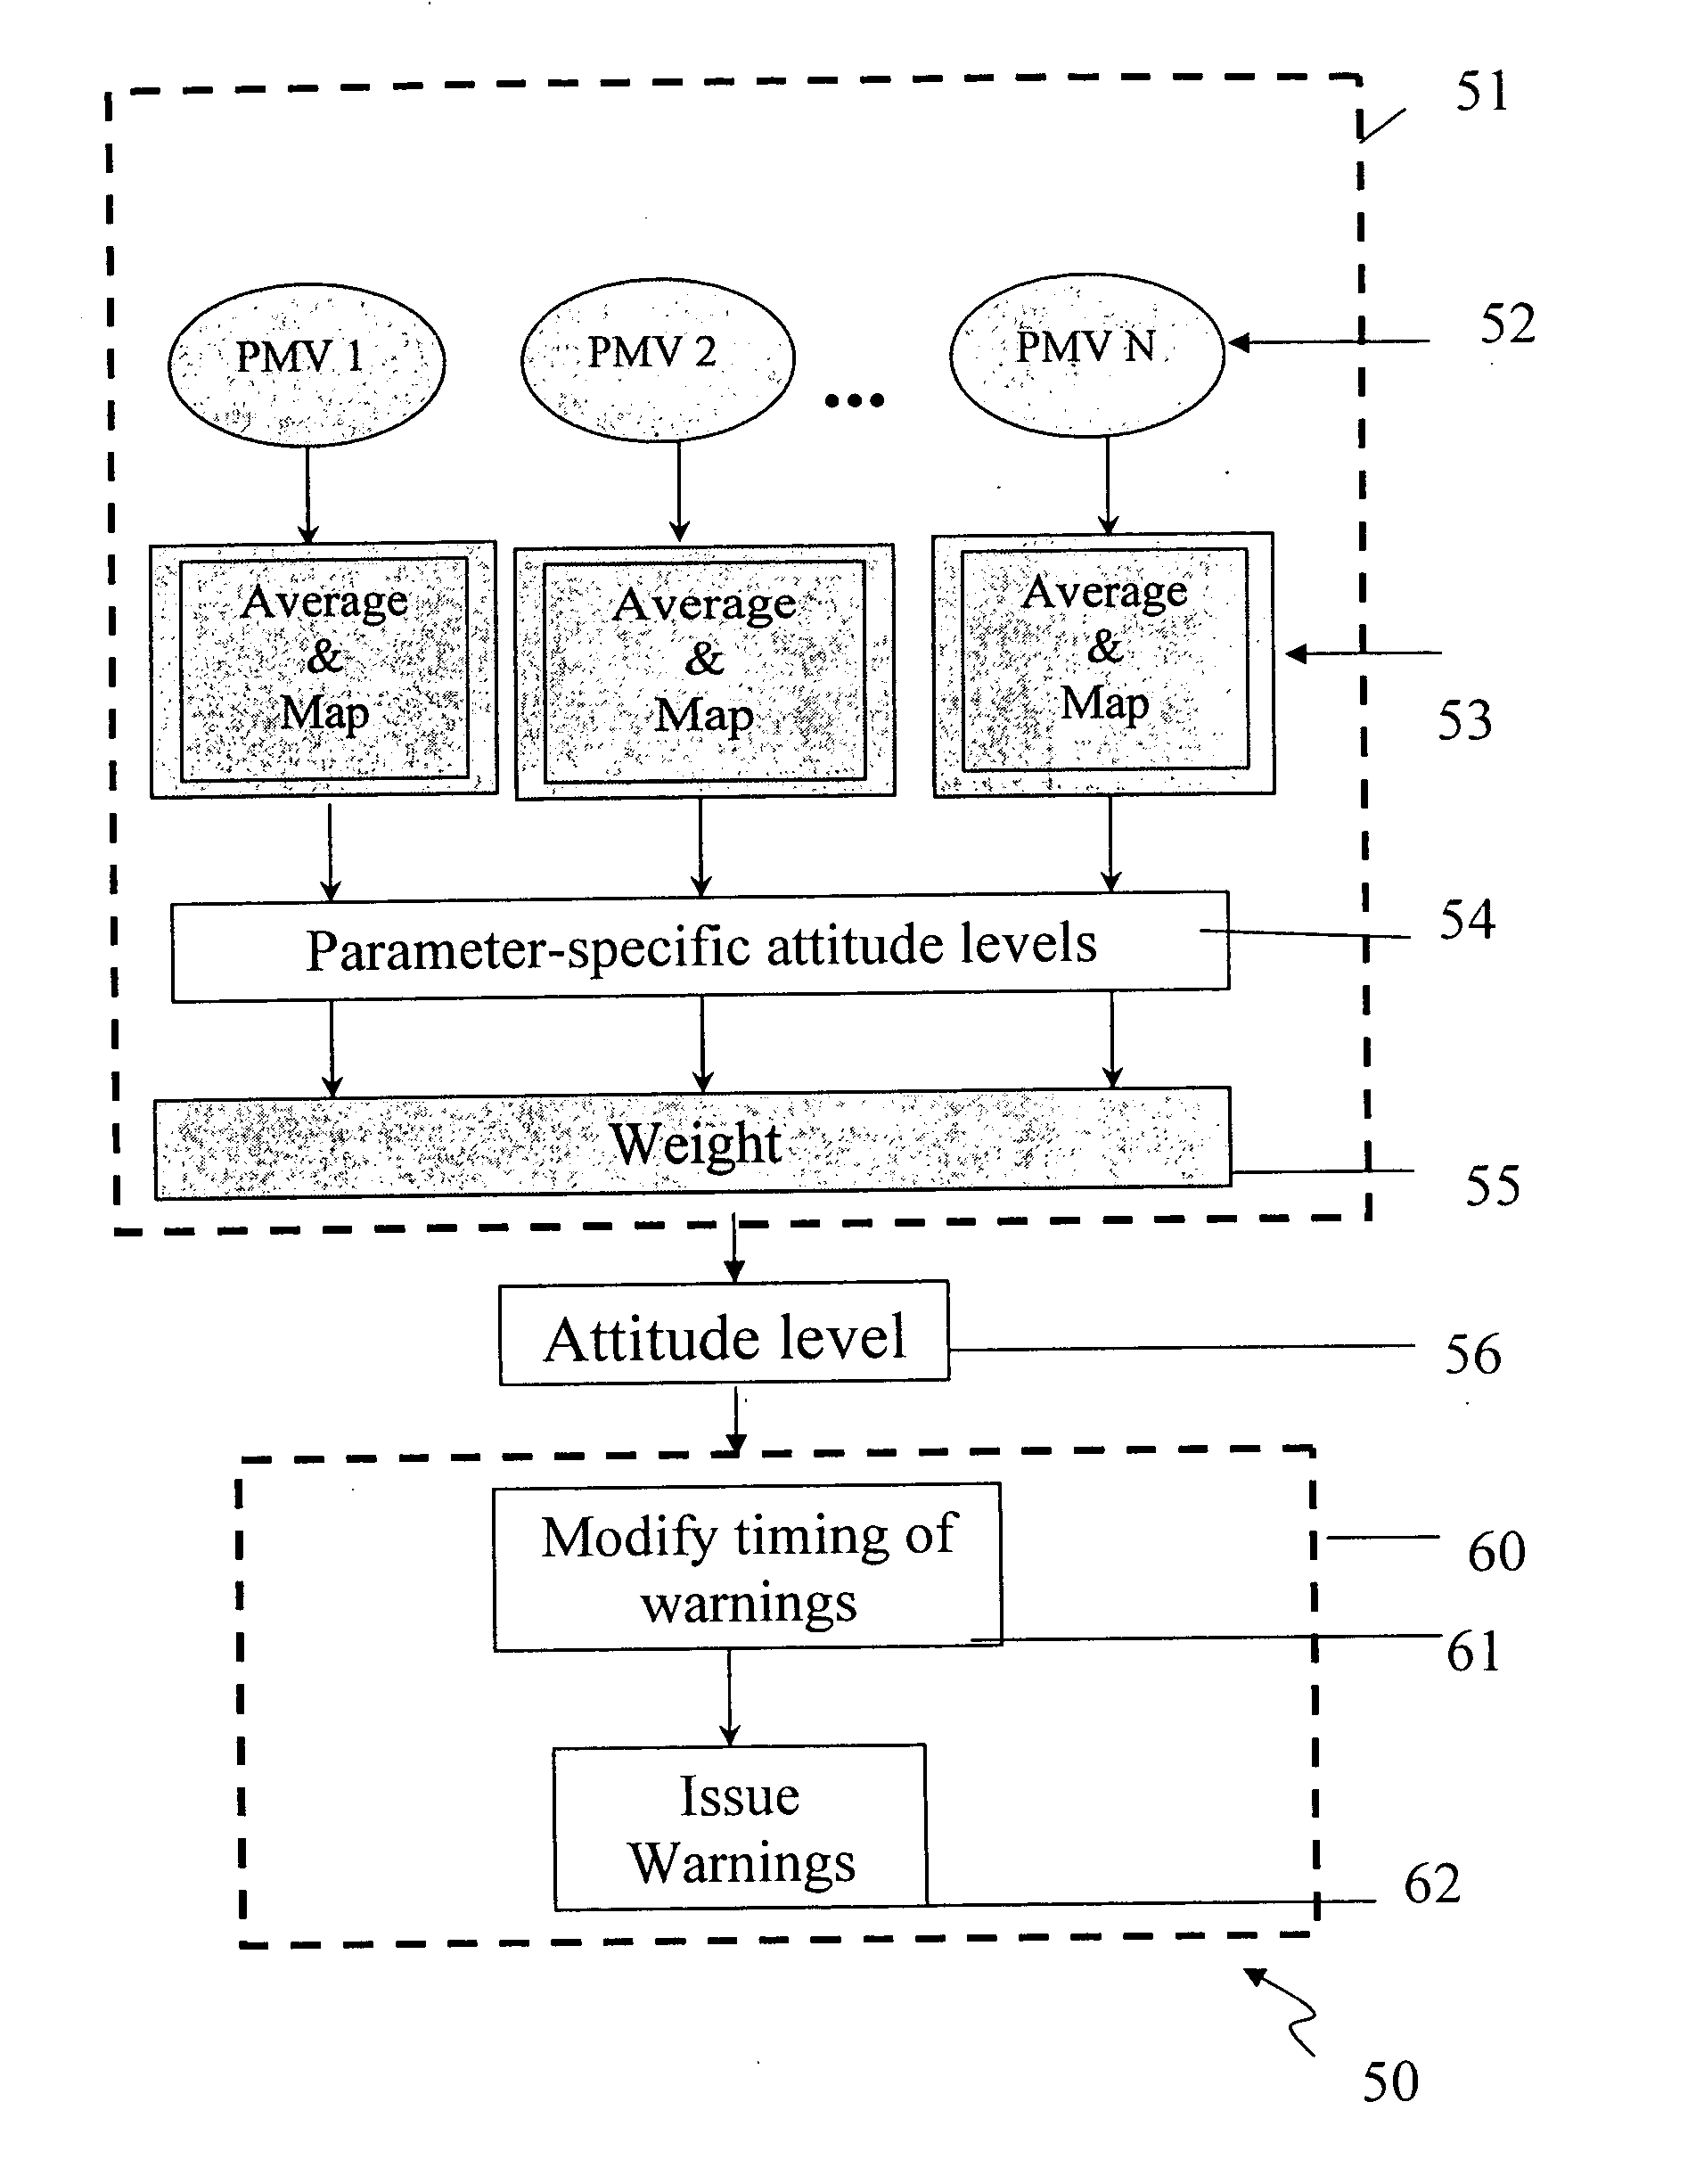
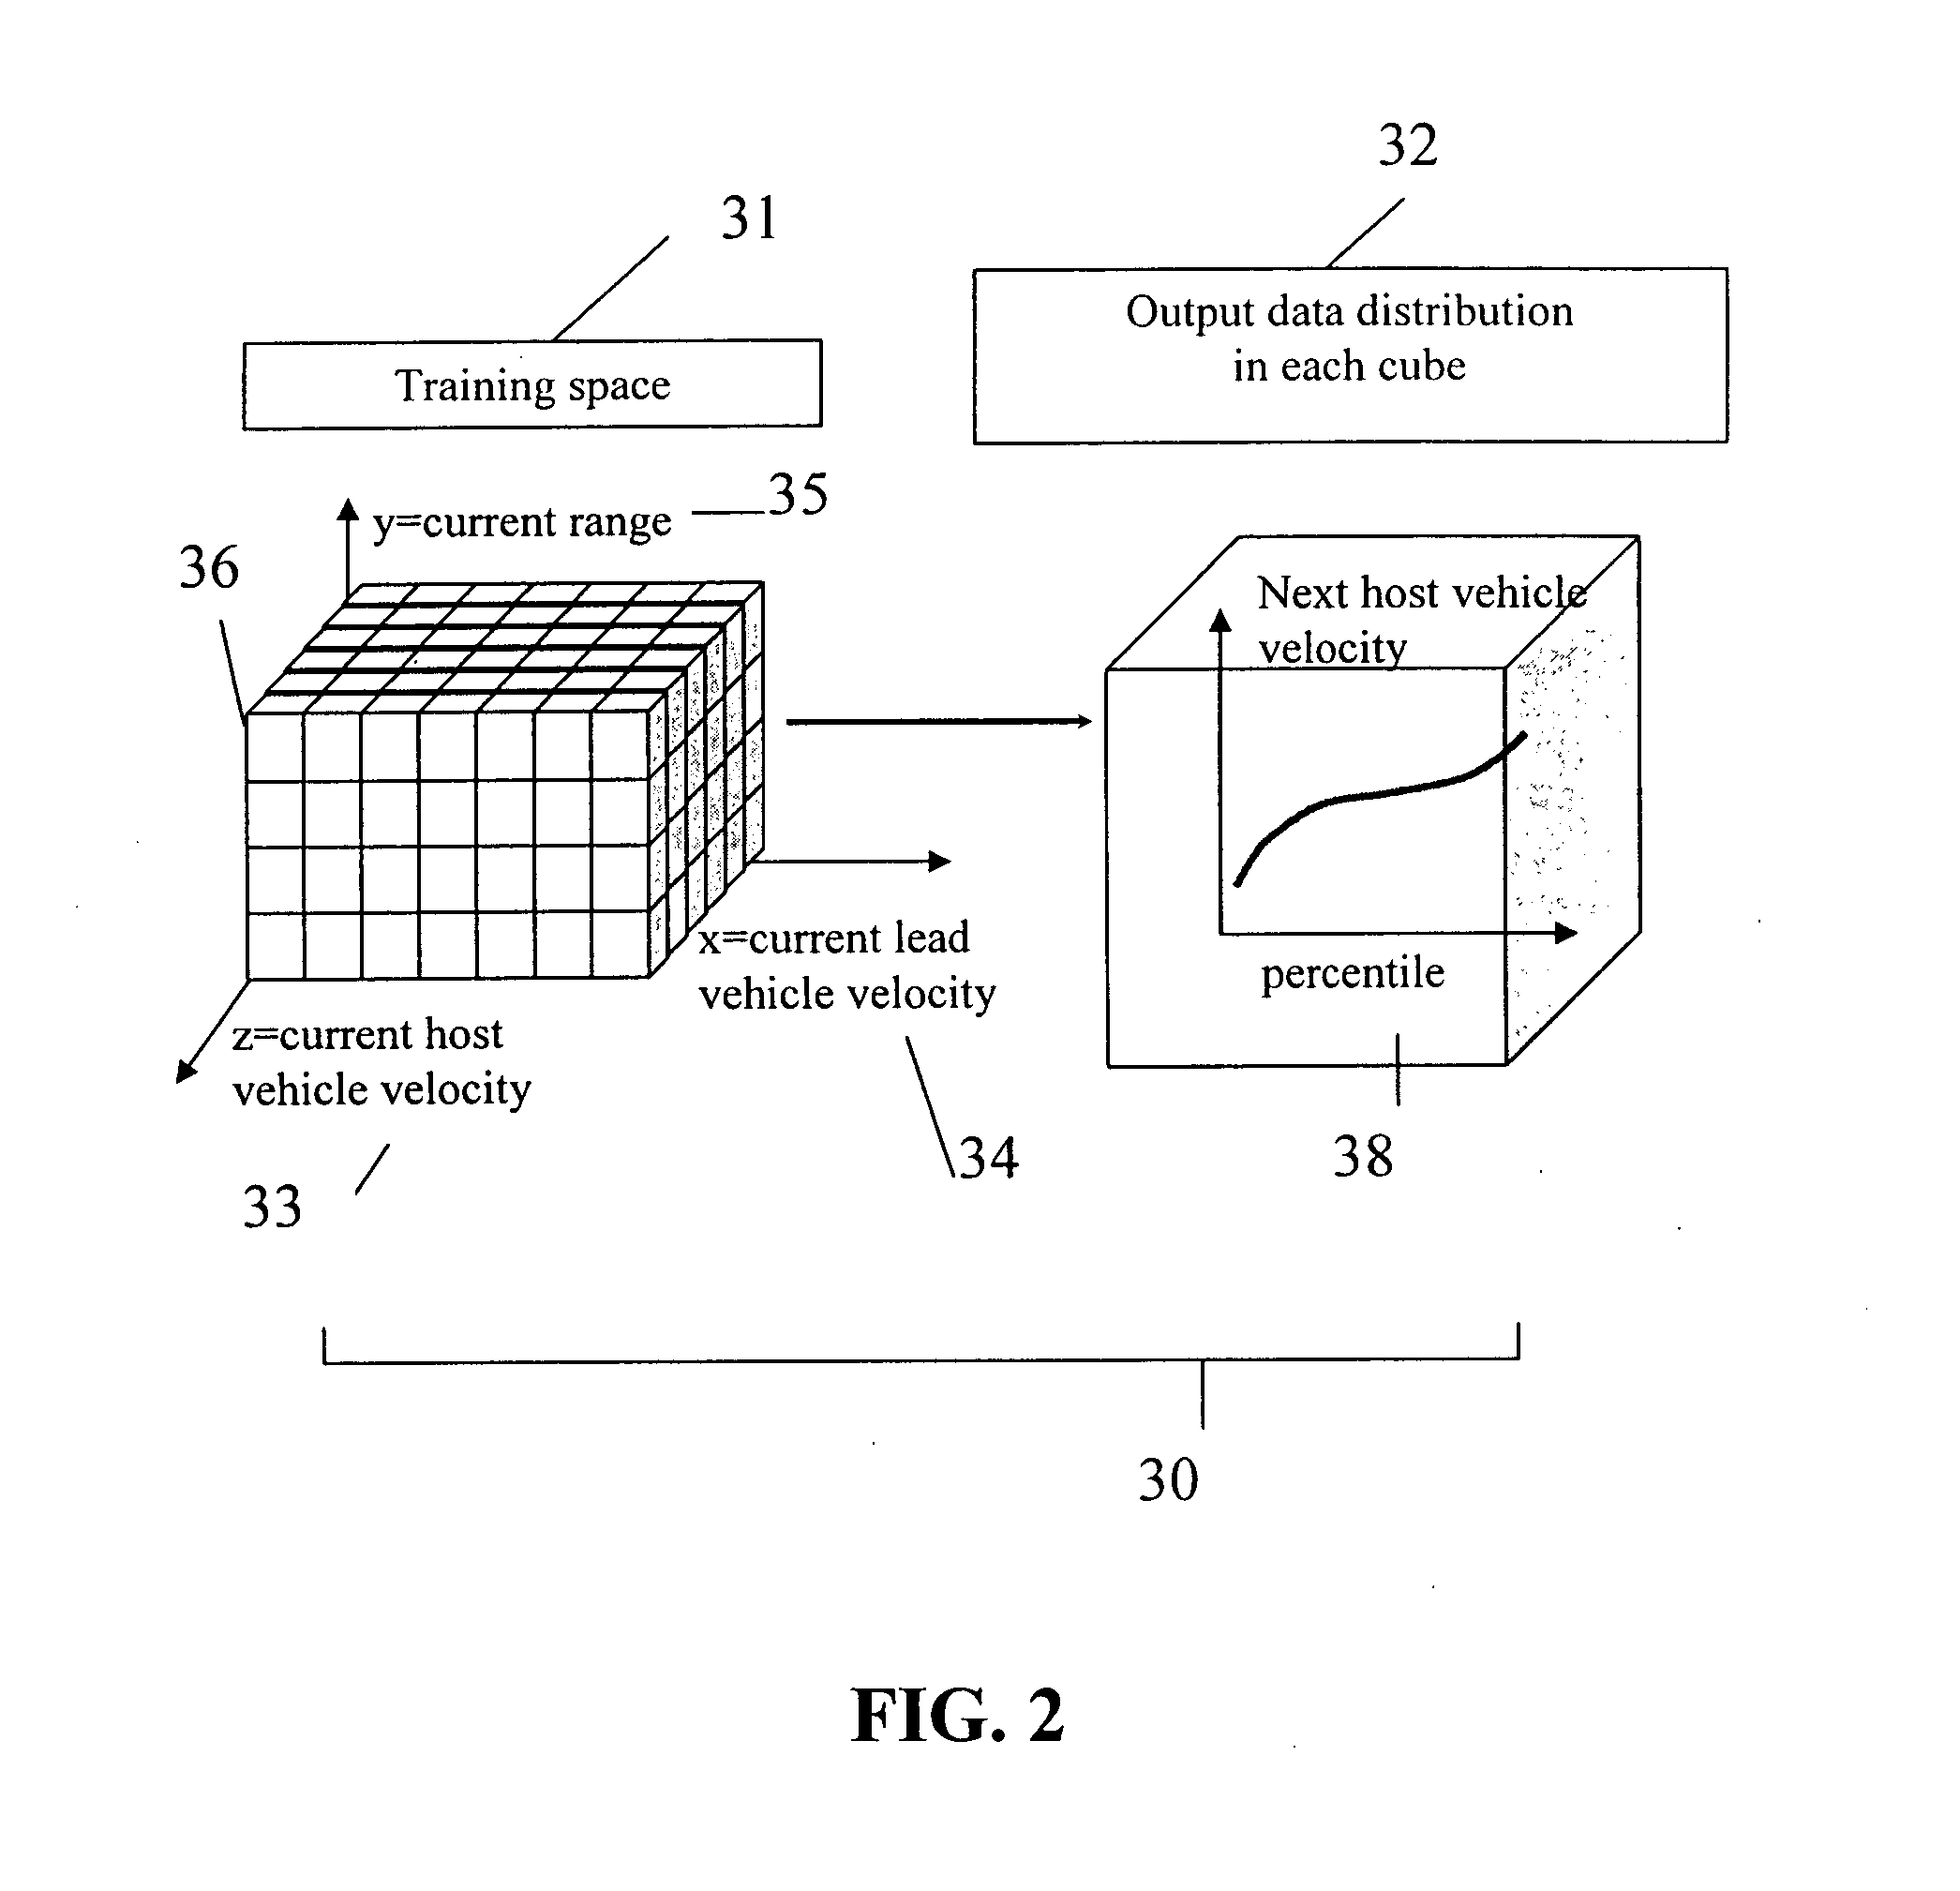
The average value of the output data stored in each PM (data stored in the PM were represented by values at the percentiles from 0 to 100, as shown in FIGS. 5A-5E) was calculated. This average value represents the driver's aggression level, based on a single parameter. A method to average the data varied, depending on the parameter. For Tares and acceleration PMs, the lowest and highest five percents of data were thrown out. Only the values of the percentiles between 5 and 95 were averaged. For the host vehicle velocity PM, only the hostv values of the percentiles between 80 and 95 were averaged. The average values for all parameters for all drivers were shown in Table 6 hereinbelow.
Step (2): Calculating Parameter-Specific Attitude Level
To determine the parameter-specific attitude level, a global min-max (minimum to ...
PUM
 Abstract
Description
Claims
Application Information
 - R&D
- Intellectual Property
- Life Sciences
- Materials
- Tech Scout
- Unparalleled Data Quality
- Higher Quality Content
- 60% Fewer Hallucinations
Browse by: Latest US Patents, China's latest patents, Technical Efficacy Thesaurus, Application Domain, Technology Topic, Popular Technical Reports.
© 2025 PatSnap. All rights reserved.Legal|Privacy policy|Modern Slavery Act Transparency Statement|Sitemap|About US| Contact US: help@patsnap.com


