
Method for correcting the effects of interdetector band broadening

a technology of interdetector band and band broadening, which is applied in the field of correcting the effects of interdetector band broadening, can solve the problems of systematic errors in derived, physical unreasonableness, and rare band-widening corrections, and achieves the effects of improving the determination of intrinsic viscosity measurements, simple, robust and easy to implemen

Active Publication Date: 2005-04-07
WYATT TECH
View PDF3 Cites 8 Cited by
  • Summary
  • Abstract
  • Description
  • Claims
  • Application Information

AI Technical Summary

Benefits of technology

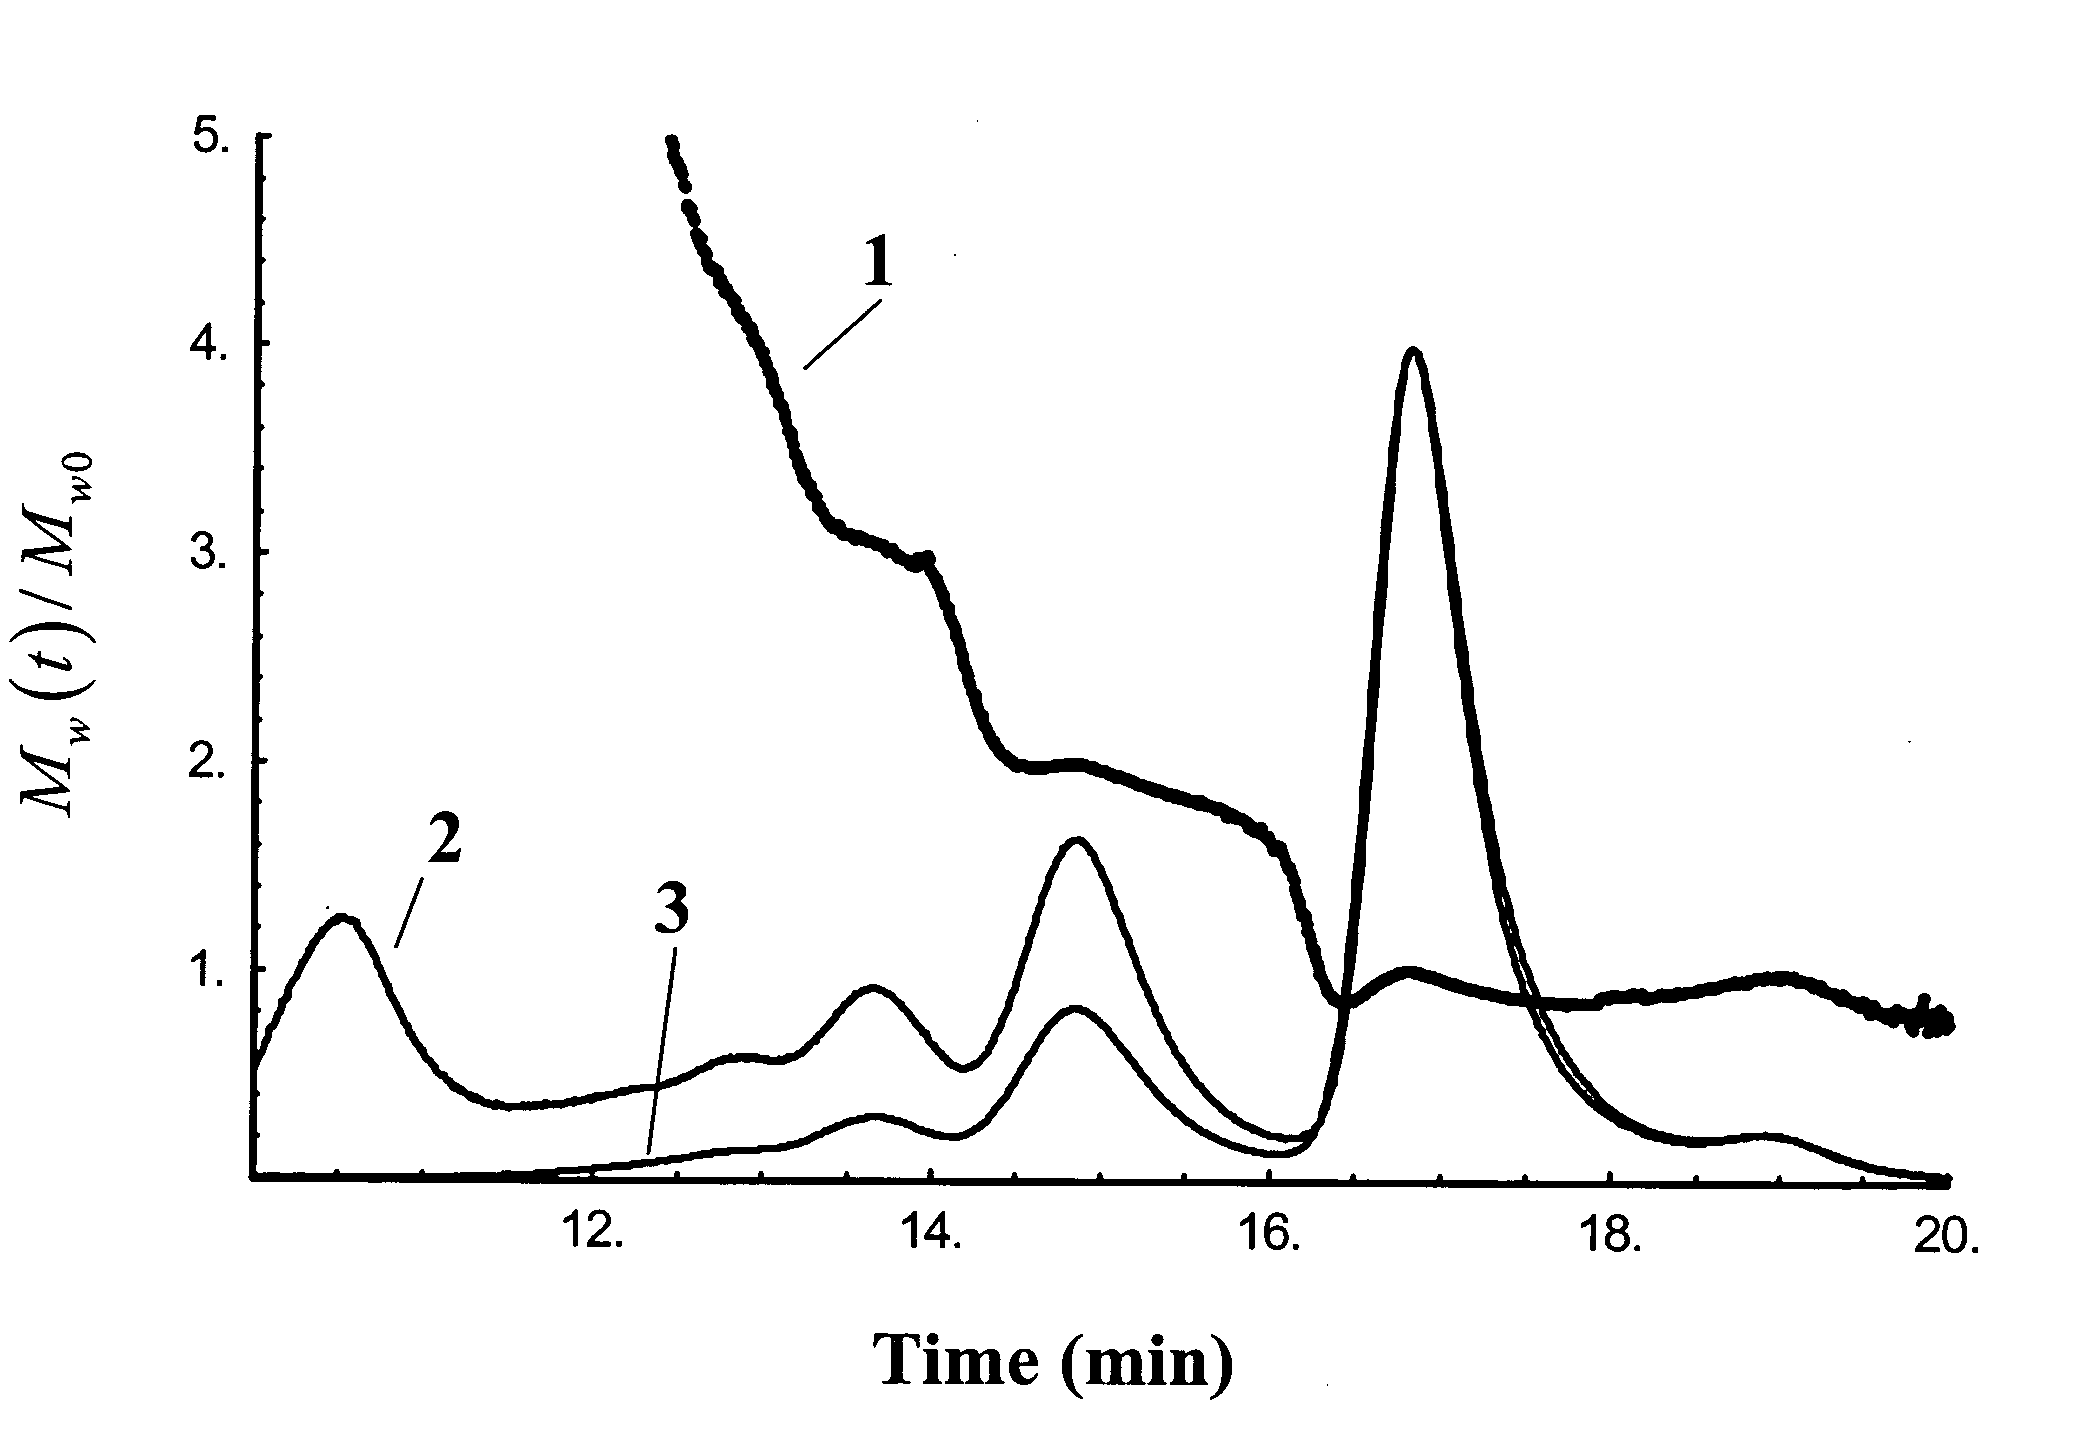
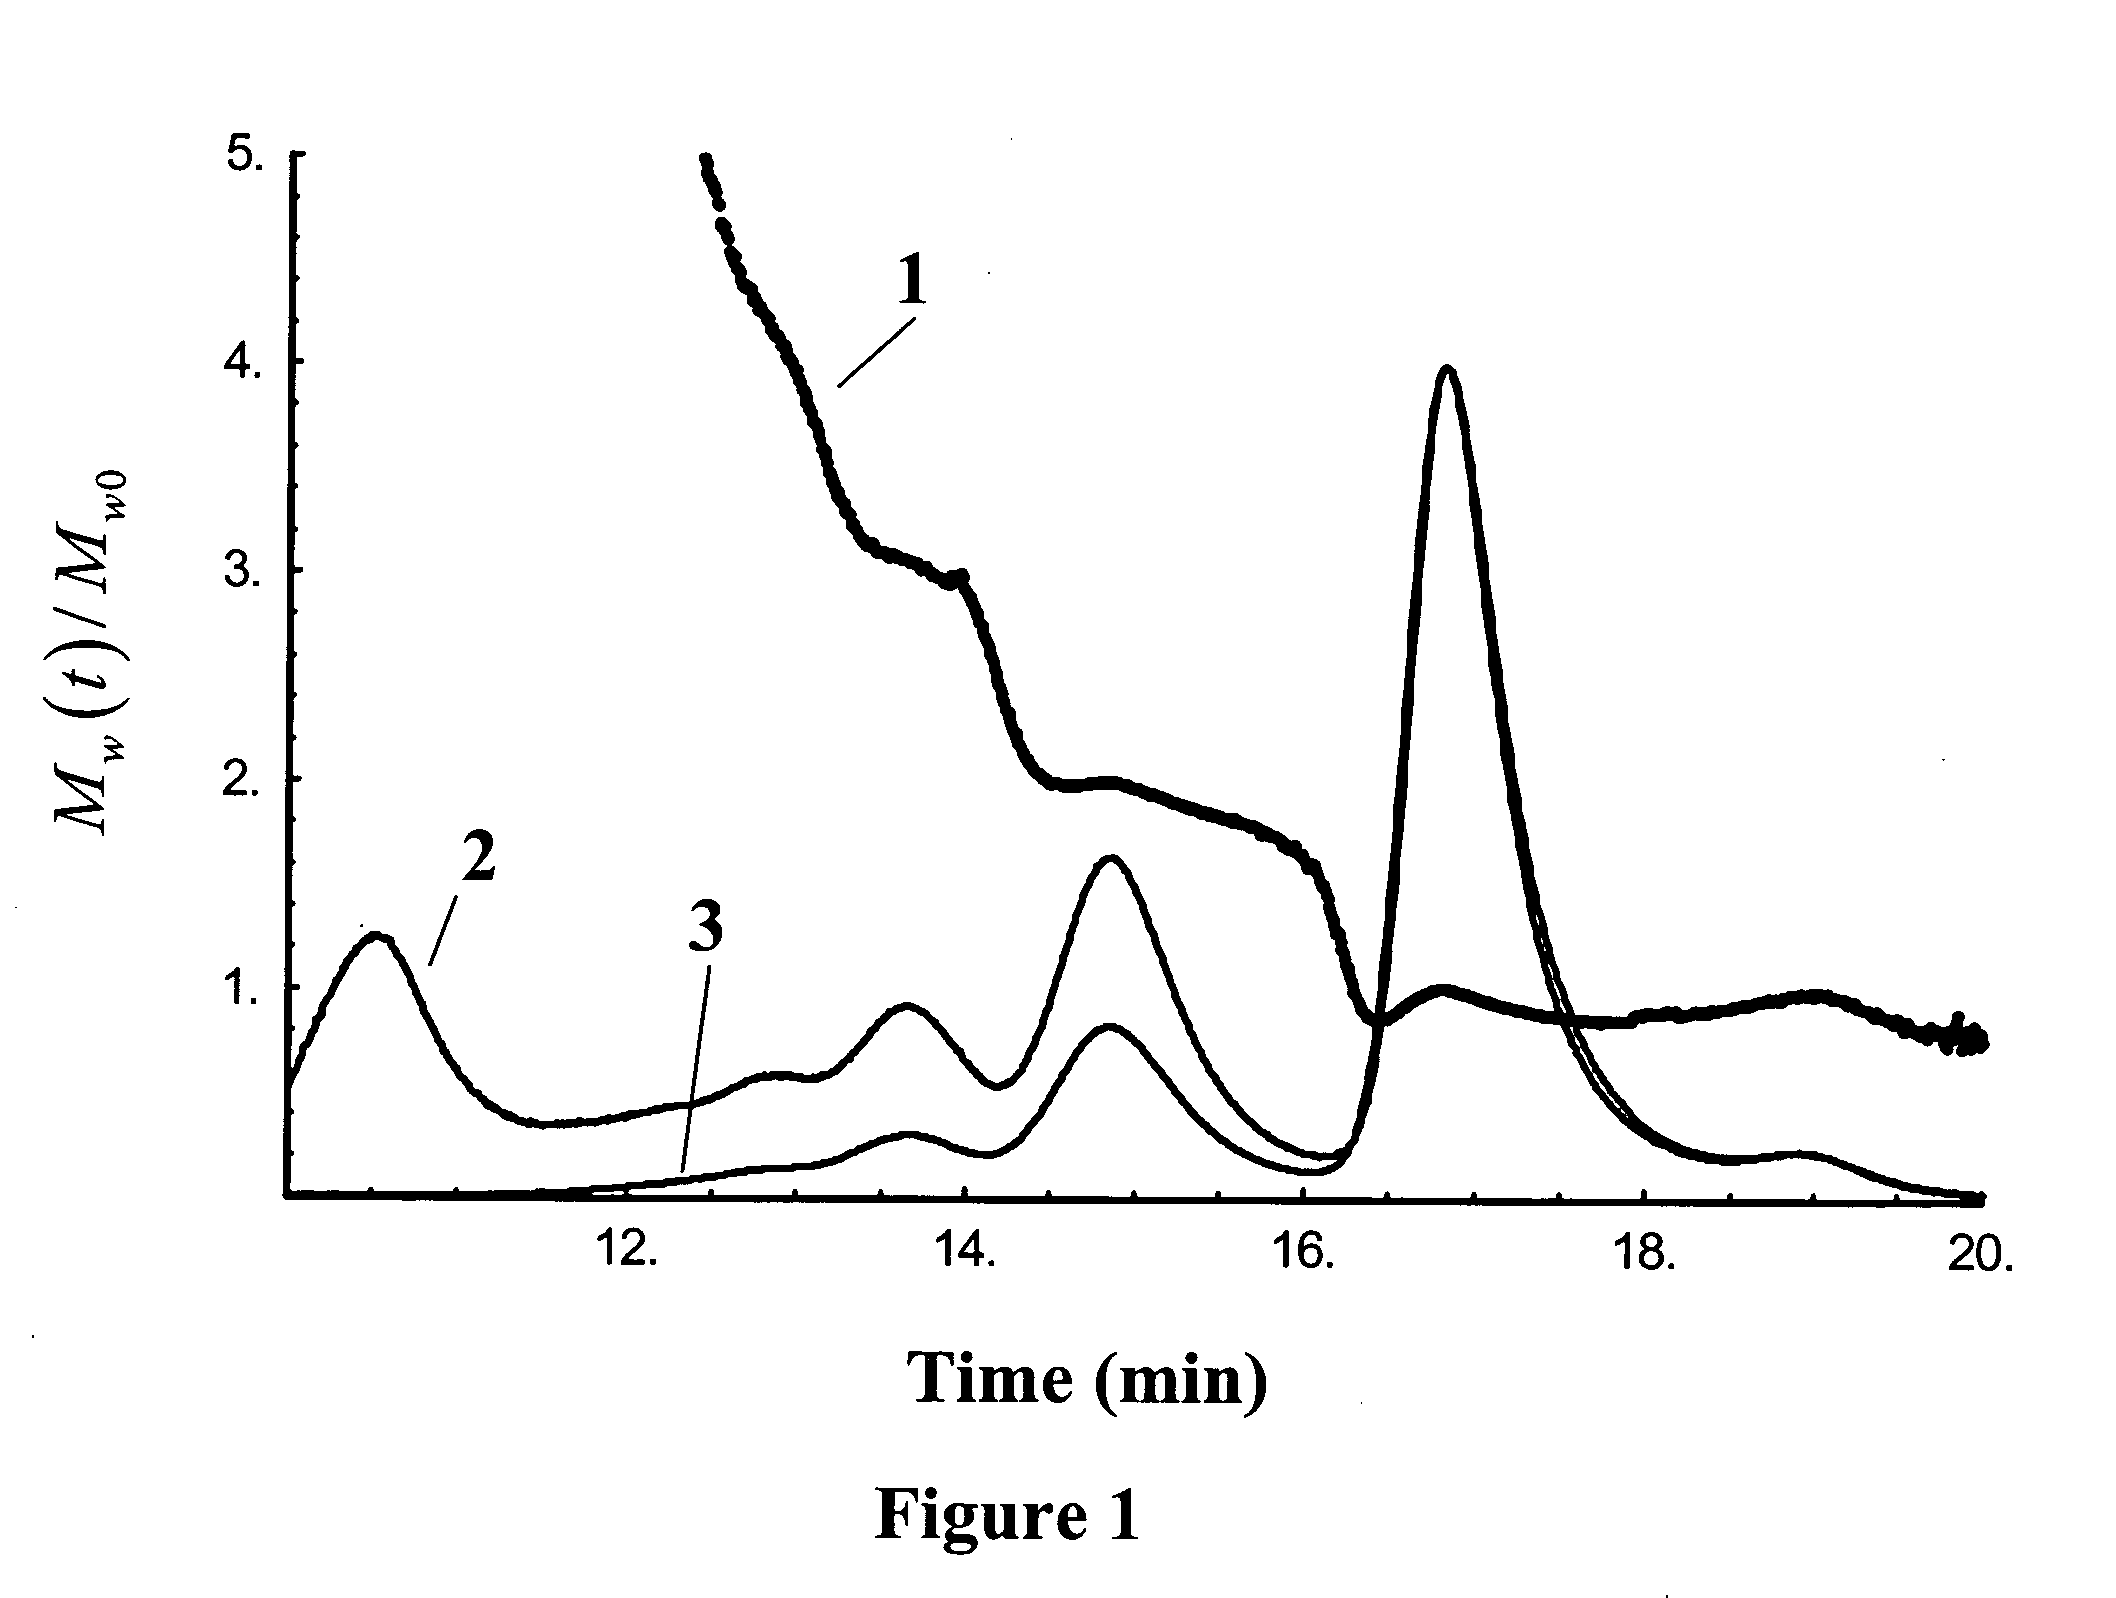
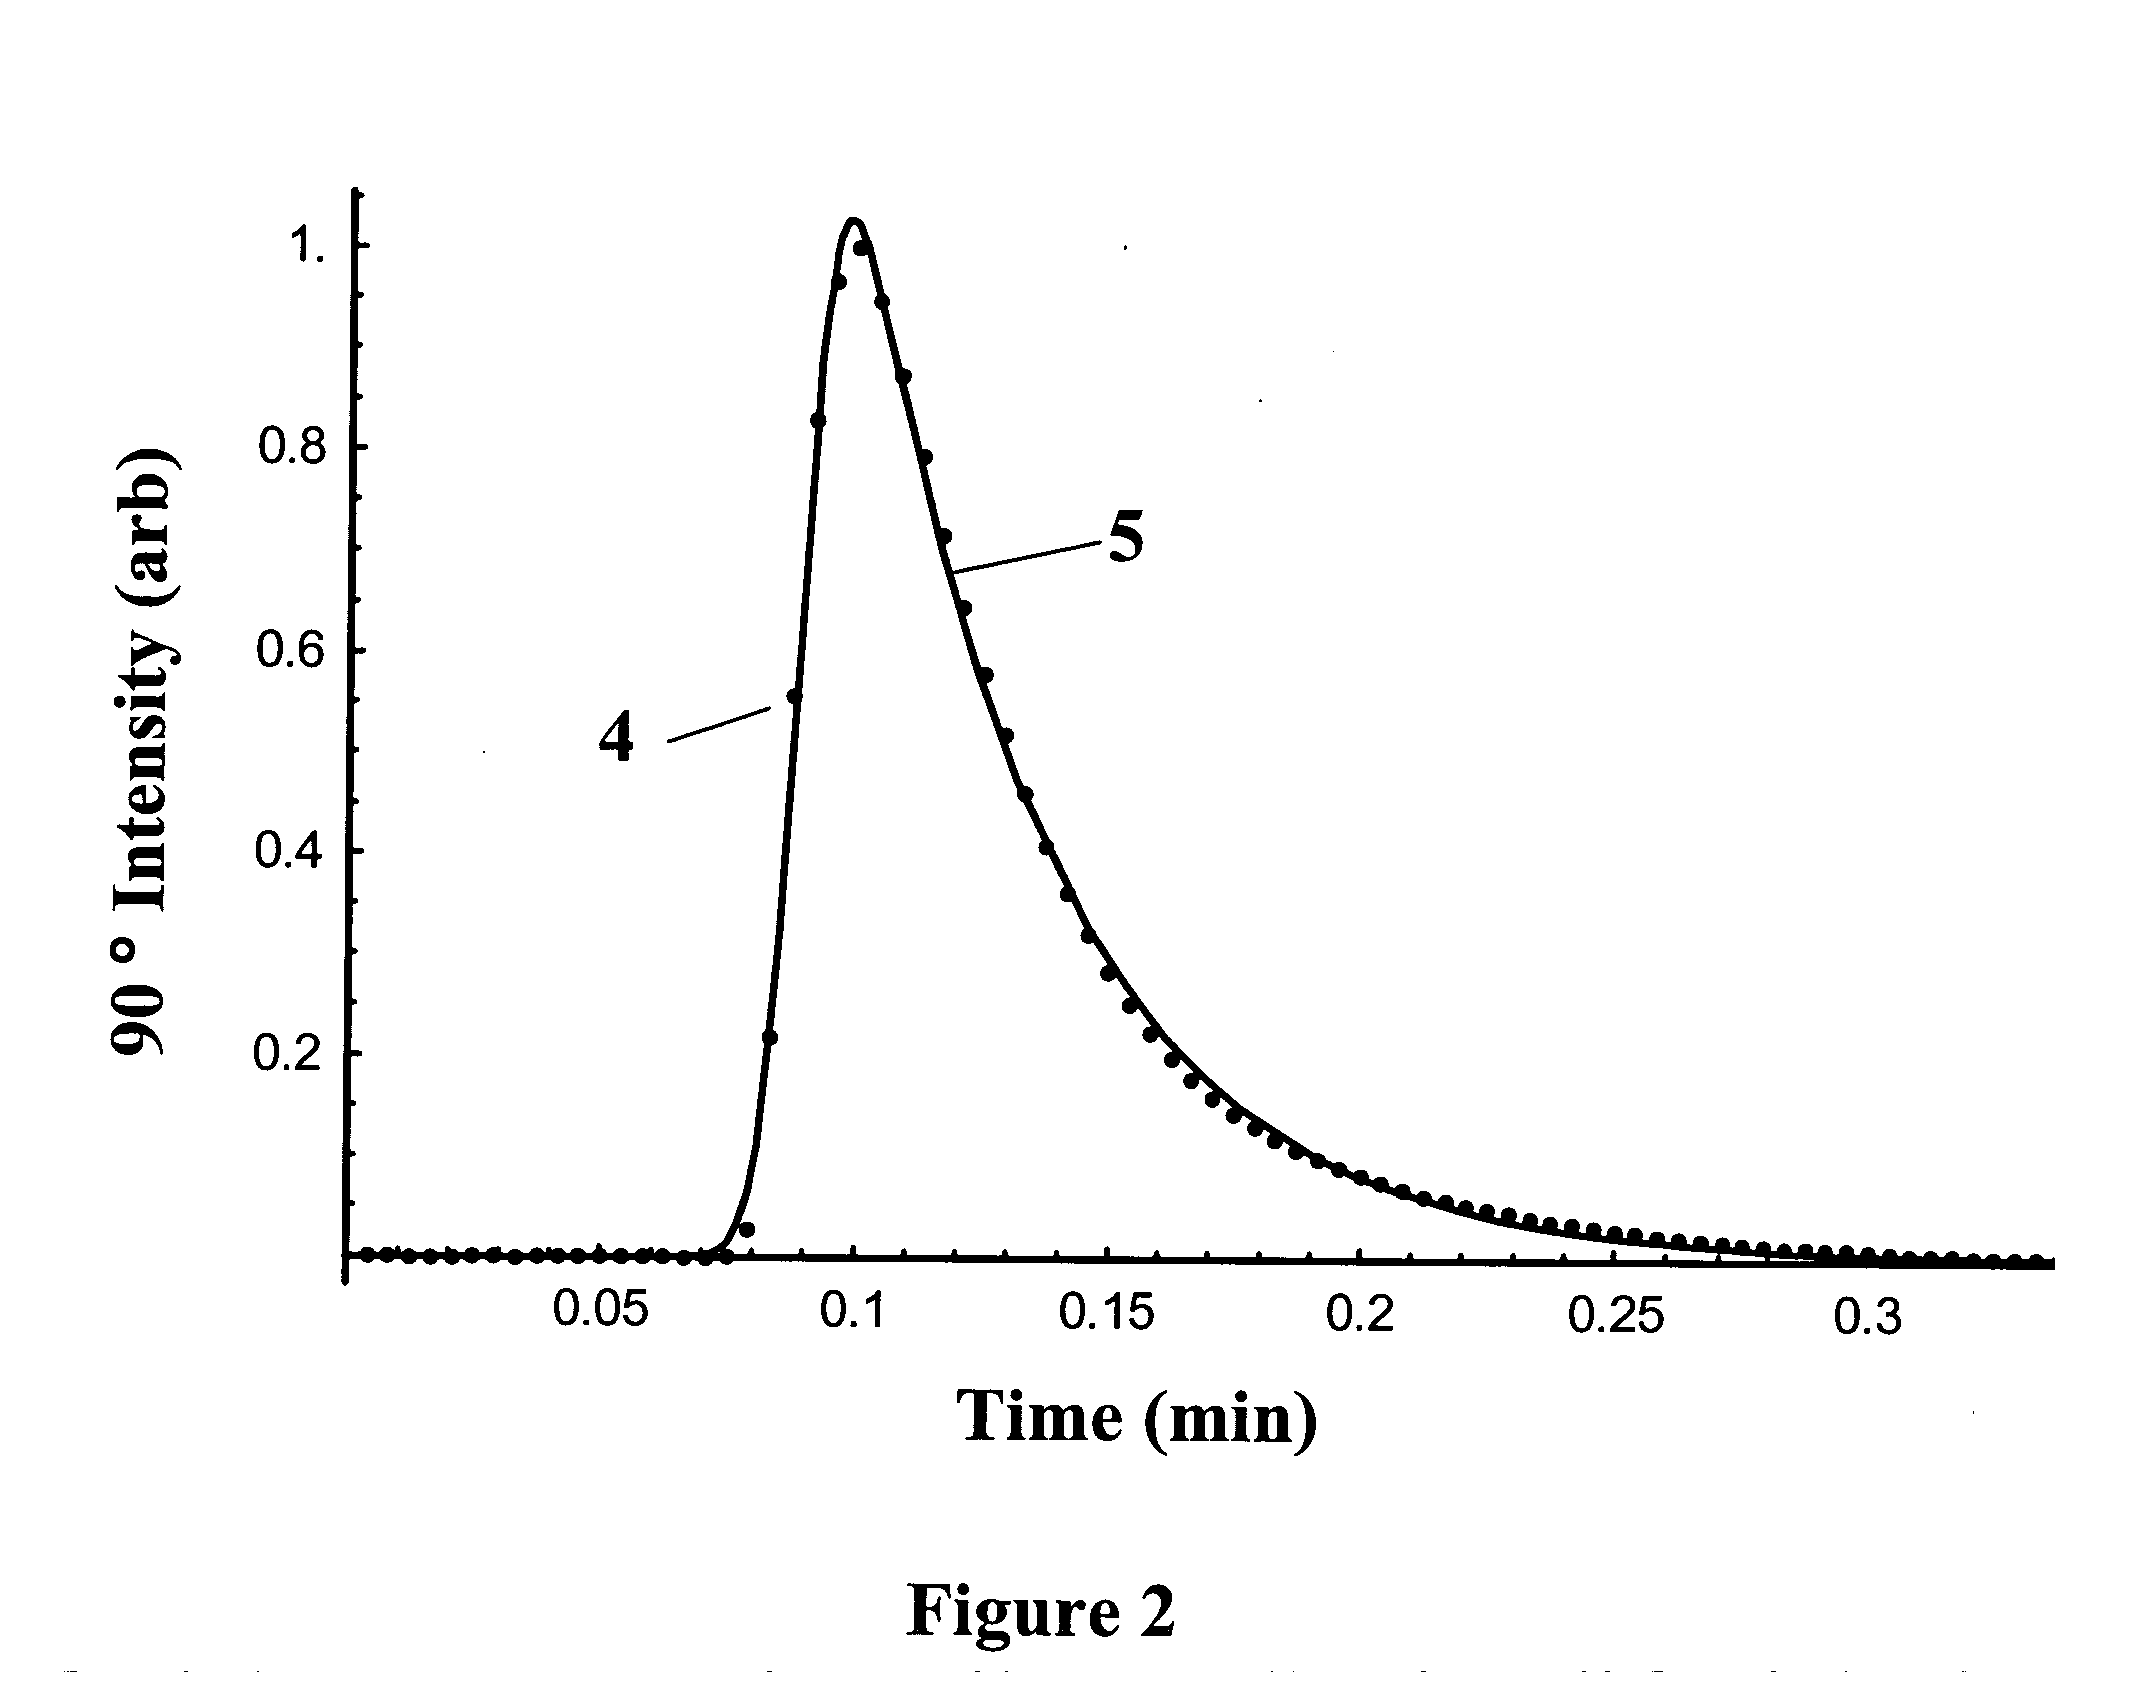
The present invention comprises a method to correct for band broadening effects occurring between detectors of a liquid chromatograph. Rather than correct the band broadening produced at a second detector by restoring the band to the form of the first, the method broadens the band of the first detector to conform to the broadened band at the second. This results in a simpler, more robust, and more easily implemented means to correct band-broadening effects at all detectors. Although the method can result in reduced peak resolution when peaks overlap partially, areas of major application are expected to be for monodisperse samples with well-separated and resolved peaks. The invention is applicable as well to any number of serially connected detectors.

Problems solved by technology

For a well fractionated sample comprised of discrete aggregate states, the problem is obvious.
Most of the techniques are numerically unstable and can result in physically unreasonable results, such as negative concentrations, or negative scattered intensities, and therefore are rarely used.
The characterization of proteins by MALS measurements represents an area of particular importance, yet even here, band-broadening corrections are rarely seen because of the difficulties associated with their implementation.
Again, the computational difficulties, associated with restoring the broadened signal to conform to what it would have been without broadening, often result in questionable results, especially if the samples are indeed monodisperse such as unaggregated proteins.
This single peak is broadened as it proceeds through the series of detectors leading to systematic errors in the derived results, unless the effect of broadening is corrected.

Method used


Image

  • Method for correcting the effects of interdetector band broadening
  • Method for correcting the effects of interdetector band broadening
  • Method for correcting the effects of interdetector band broadening

Examples


Embodiment Construction

Molecules in solution are generally characterized by their weight averaged molar mass Mw, their mean square radius <rg2>, and the second virial coefficient A2. The latter is a measure of the interaction between the molecules and the solvent. For unfractionated solutions, these properties may be determined by measuring the manner by which they scatter light using the method described by Bruno Zimm in his seminal 1948 paper that appeared in the Journal of Chemical Physics, volume 16, pages 1093 through 1099. More recently, the method discussed in co-pending Application Ser. No. 10 / 205,637 by Trainoff and Wyatt filed 24 Jul. 2002, in process of issuance, represents an advanced technique that will replace the more traditional Zimm approach.

The light scattered from a small volume of the solution is measured over a range of angles and concentrations. The properties derived from the light scattering measurements are related through the formula developed by Zimm:

R(θ)=K*MwcP(θ)[1−2A...


PUM


Abstract

Chromatographic separations are often characterized by multiple detectors though which the sample flows serially. As the sample flows between detectors, it becomes progressively diluted due to mixing and diffusion. This phenomenon is traditionally called “band broadening” and often results in significant distortion of the calculated physical properties such as molar mass and size. This is particularly true for the case of monodisperse samples such as proteins. A new procedure is described whereby most types of band broadening may be corrected resulting in more accurate calculations of such physical properties. The conventional means for correcting band broadening effects is based upon mathematical procedures that attempt to narrow the broadened peak to its prebroadened form. Such procedures are notoriously unstable and often result in unphysical results such as ringing, negative concentrations, or negative scattered intensities. This disclosure describes a method to characterize the broadening present in a chromatographic system, and an algorithm whereby the narrow peaks of the upstream detector are artificially broadened so that they can be compared to the broadened peaks of the downstream detector. Although the technique results in some loss of resolution, its stability and generality allow it a broad range of application. Examples include correction of RI detector broadening following MALS detectors, correction of MALS broadening following UV detection, correction of viscometric broadening following both MALS and RI detection, and all permeations thereof.

Description

BACKGROUND The analysis of macromolecular species in solution by liquid chromatographic techniques is usually achieved by preparing a sample in an appropriate solvent and then injecting an aliquot thereof into a chromatograph. The chromatograph includes fractionation devices of various types that separate the sample as it passes through them. Once separated by such means, generally based on size, mass, or column affinity, the samples are subjected to analysis by means of light scattering, refractive index, UV, viscometric response, etc. For example, in order to determine the mass and size distributions of a particular sample whose separation is performed by size exclusion columns, the chromatograph would measure the sample sequentially by multiangle light scattering, MALS followed by a differential refractometer, dRI. The dRI determines the concentration while the MALS unit measures the excess Rayleigh ratio as a function of angle of each eluting fraction. For molecules very much s...

Claims


Application Information

Patent Timeline
IPC IPC(8): G01N30/02G01N30/74G01N30/78G01N30/86G01N30/88
CPCG01N30/74G01N30/78G01N30/8624G01N21/4133G01N21/47G01N30/8637
Inventor TRAINOFF, STEVEN P.
Owner WYATT TECH
Learn More