System and method for monitoring and analyzing data trends of interest within an organization

a technology of data trends and systems, applied in office automation, resources, marketing, etc., can solve the problems of inability to integrate data from different but related sources, and inability to integrate the various systems and data to uncover relationships

Inactive Publication Date: 2003-09-04
CHILDRENS MERCY HOSPITAL
View PDF5 Cites 39 Cited by
  • Summary
  • Abstract
  • Description
  • Claims
  • Application Information

AI Technical Summary

Benefits of technology

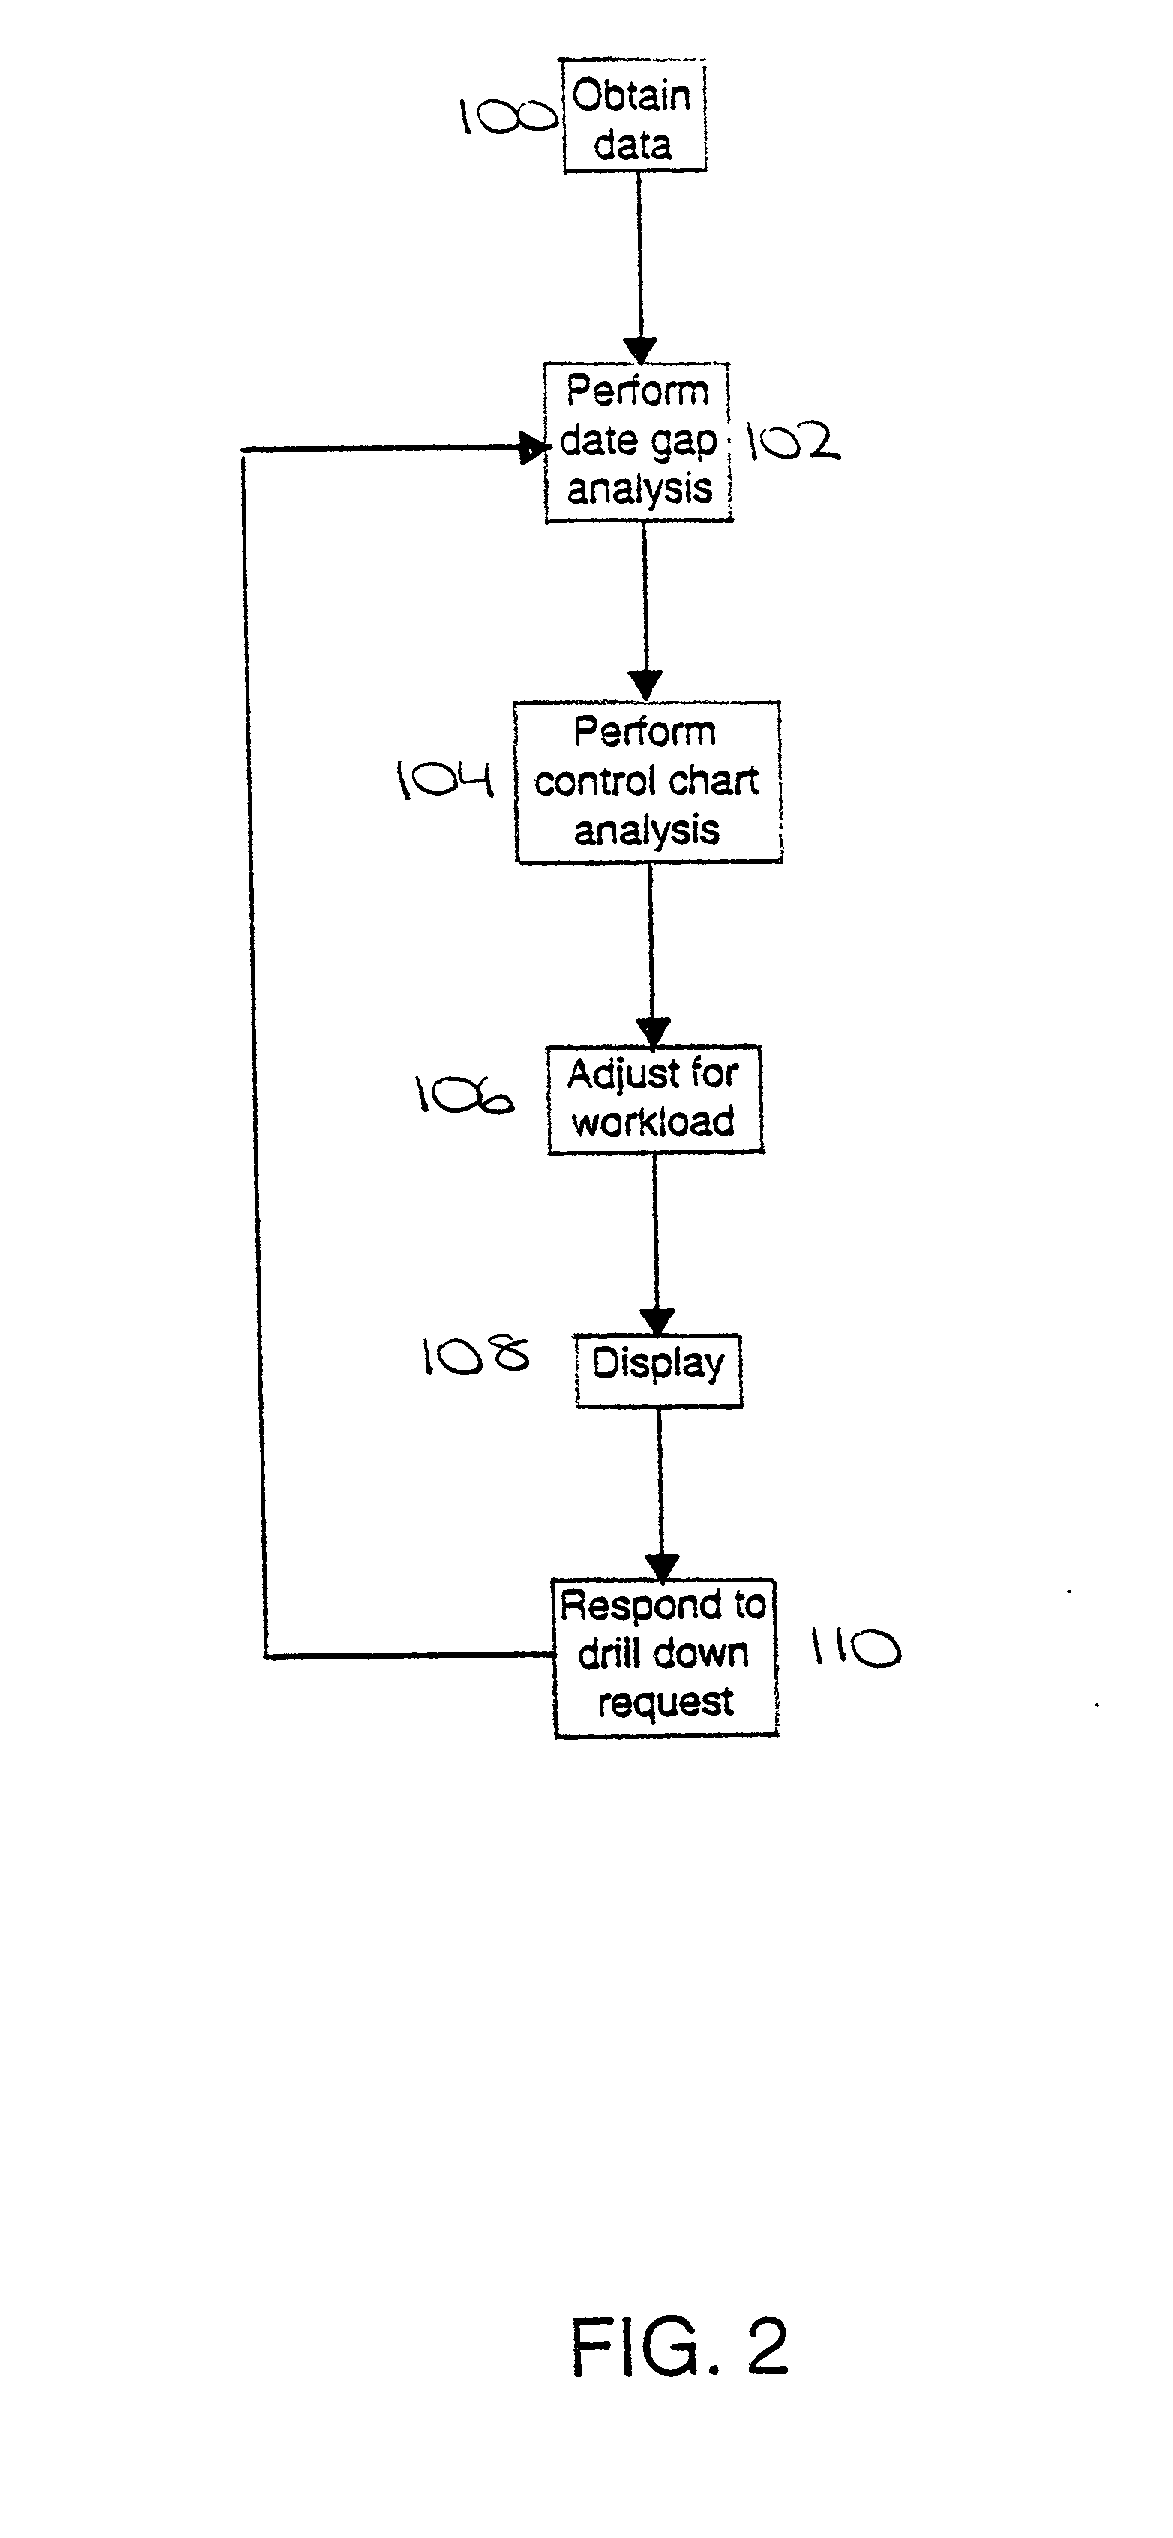
[0016] After performing date gap analysis, the control chart analysis is performed and the results thereof displayed in tabular or graphical form. The graphical format represents the date gap between successive events plotted in temporal sequence, which allows for quick visual identification of slow and gradual trends as well as rapid changes in the frequencies of events. The graphical format also includes control limits computed based upon the variability of the date gaps, which allow the user to easily separate special causes of variation ("signals") from common cause of variation (i.e., random noise). Data quality checking is provided in the form of control limits representing variation beyond that expected from common causes. When a data gap exceeds the upper control limit, a reporting irregularity may be indicated and should be investigated.

Problems solved by technology

Stand-alone administrative software systems are typically unable to integrate data from different but related sources because each administrative system stores its own data in isolation and uses incompatible coding systems.
There may be, for example, separate systems for tracking workplace injuries and illnesses, production line errors, consumer complaints, and employee turnover, and no way to integrate the various systems and data to uncover relationships.
Though combining the administrative software with statistical software may make possible the integration of data from multiple sources, doing so often requires difficult and labor intensive data translations, and, even after the data is translated, inconsistencies in coding information may remain.
Stand-alone administrative software systems typically rely on artificial boundaries for aggregating event data, which may mask the development of new and interesting trends.
These artificial boundaries may also undesirably delay the reporting of information.
Identifying a sudden shift in employee accidents, for example, may not be possible until the end of the reporting period, whether the period is a month or a quarter or longer.
Furthermore, it can be difficult to effectively model data received on a monthly or quarterly basis rather than a daily or even constant basis.
Unfortunately, there are several problems with this approach, including that employee injuries and illnesses may not meet all of the assumptions for a Poisson distribution; the time interval is arbitrary and makes chart comparison difficult; and C charts may have difficulty detecting particularly rare illnesses or injuries.
Thus, though useful in analyzing data of interest, control chart analysis is limited when based upon monthly or quarterly reports.
Many stand-alone administrative software systems also fail to produce appropriate reports.
Unfortunately, though combining statistical software will generally produce a wider variety of graphs and reports than stand-alone administrative software, the variety may be so broad and the choices so complex as to require extensive training merely to understand the options.
When patterns are identifiable from a comparison of several disparate reports, the system frustrates further attempts to investigate these trends.
That is, existing administrative software systems typically fail to provide a simple and efficient mechanism for delving into greater levels of detail to uncover possible causes of the trends or patterns of interest, and incompatible coding schemes or formats may make such detailed investigation difficult or impossible.
Combining general-purpose statistical software is likely to be of no help as it also fails to provide for a simple method of detailed investigation of trends and patterns of interest to identify underlying causes.
Those statistical-based methods that do attempt to provide this ability are complex and require extensive training to use effectively.
Additionally, administrative software systems typically do not have any built-in data quality checks.
For example, there may be no way to detect a reporting gap, such as may occur when employees fail to report production errors because their workload is too heavy.
Again, combining general-purpose statistical software is likely to be of little help as it typically includes no automated data quality checks to identify, for example, reporting gaps, making the software only as good as the data provided to it.
In the prior art, acquiring and formatting this data would take several hours or days to complete.

Method used


Image

  • System and method for monitoring and analyzing data trends of interest within an organization
  • System and method for monitoring and analyzing data trends of interest within an organization
  • System and method for monitoring and analyzing data trends of interest within an organization

Examples


Embodiment Construction

, below.

BRIEF DESCRIPTION OF THE DRAWING FIGURES

[0019] A preferred embodiment of the present invention is described in detail below with reference to the attached drawing figures, wherein:

[0020] FIG. 1 is a block diagram of computer hardware and code segments which may be used to implement a preferred embodiment of the present invention.

[0021] FIG. 2 is a flow diagram broadly depicting the steps of a preferred embodiment of the method of the present invention.

[0022] FIG. 3 is a conventional X-bar control chart showing a range of plotted data moving about a centerline and bounded, for the most part by, control limits.

[0023] FIG. 4 is control chart resulting from a preferred embodiment of the present invention.

DETAILED DESCRIPTION OF A PREFERRED EMBODIMENT

[0024] FIG. 1 illustrates a preferred embodiment of a computer-based system 10 for monitoring and analyzing workplace illnesses and injuries. Though described and illustrated in terms of this specific application, the present inventi...


PUM


Abstract

A system and method for identifying, monitoring, and analyzing various trends and patterns of interest within an organization in order to maximize aspects thereof, including, for example, productivity, efficiency, and employee health and safety. The invention utilizes a centralized data repository to accessibly store and maintain data; date gap analysis to avoid aggregation on calender or other artificial boundaries; control chart analysis to allow for easy understanding of the data; workload adjustments to avoid false indicators; tabular and graphical data displays which facilitates identifying anomalous data and monitoring for data quality; and a drill down mechanism for investigating trends and anomalous data points in detail. Analysis may be performed on various normalized data sets and the results simultaneously displayed to allow comparison and easier identification of interrelated variables and, thereby, of cause and effect. The effectiveness of remedies and intervention schemes may also be monitored and analyzed.

Description

COMPUTER PROGRAM LISTING APPENDIX[0001] A computer program listing appendix containing the source code of a computer program that may be used with the present invention is incorporated herein by reference and appended hereto as one (1) original compact disk, and an identical copy thereof, containing a total of 93 files as follows:1 Filename Size (Bytes) Date of Creation ACTCAT.about.1 FRM 2,004 Nov. 28, 2000 9:40 a ACTDBR.about.1 FRM 1,983 Sep. 28, 2000 10:47 a ACTLEV.about.1 FRM 1,992 Sep. 28, 2000 10:06 a ACTMGR.about.1 FRM 1,951 Nov. 28, 2000 9:41 a ACTOWN.about.1 FRM 1,983 Sep. 28, 2000 10:04 a ACTPRI.about.1 FRM 1,990 Sep. 28, 2000 10:06 a ACTUNI.about.1 FRM 1,985 Sep. 28, 2000 10:07 a ACTUSR.about.1 FRM 1,979 Sep. 28, 2000 10:09 a ACTWOR.about.1 FRM 1,987 Sep. 28, 2000 10:21 a CCAM INI 5,014 Dec. 20, 2000 7:37 a CCAM VBP 3,543 Dec. 22, 2000 11:21 a CCAM VBW 1,718 Dec. 22, 2000 3:03 p CCSS INI 721 Dec. 24, 2000 11:05 a CCSS VBP 1,518 Dec. 24, 2000 5:04 p CCSS VBW 544 Dec. 24, 2...

Claims


Application Information

Patent Timeline
Patent Type & Authority Applications(United States)
IPC IPC(8): G06Q10/06G06Q10/10G06Q20/10G06Q30/02
CPCG06Q10/063G06Q30/0201G06Q20/108G06Q10/10
Inventor SANTOS, SUSAN R.SIMON, STEPHEN D.COX, KAREN
Owner CHILDRENS MERCY HOSPITAL
Why Eureka
Try Eureka