


Quick Research
Generate reliable direction feasibility study reports for your R&D in just a few steps.

Technical Q&A
Discover and master advanced knowledge NOW. Basics, ideas, possibilities, all at once.

Find Solutions
As an expert in R&D theories, this can generate solutions to your technical problems instantly.

Evaluate Feasibility
Analyze your overall solution with one click, know your potential R&D risks in advance.

Monitor Landscape
Get weekly tech updates, stay abreast of the latest tech innovations and key insights.
Power distribution network operation data anomaly judgment method based on data mining
A technology for operating data and abnormality determination, which is applied in the field of power systems and can solve problems such as incorrect data records, abnormal user power consumption, and abnormal electricity meters.
- Summary
- Abstract
- Description
- Claims
- Application Information
AI Technical Summary
Problems solved by technology
Method used
Image

Examples
Embodiment 1
[0049] refer to Figure 1~5 , which is an embodiment of the present invention, provides a data mining-based abnormality determination method for distribution network operation data, including:
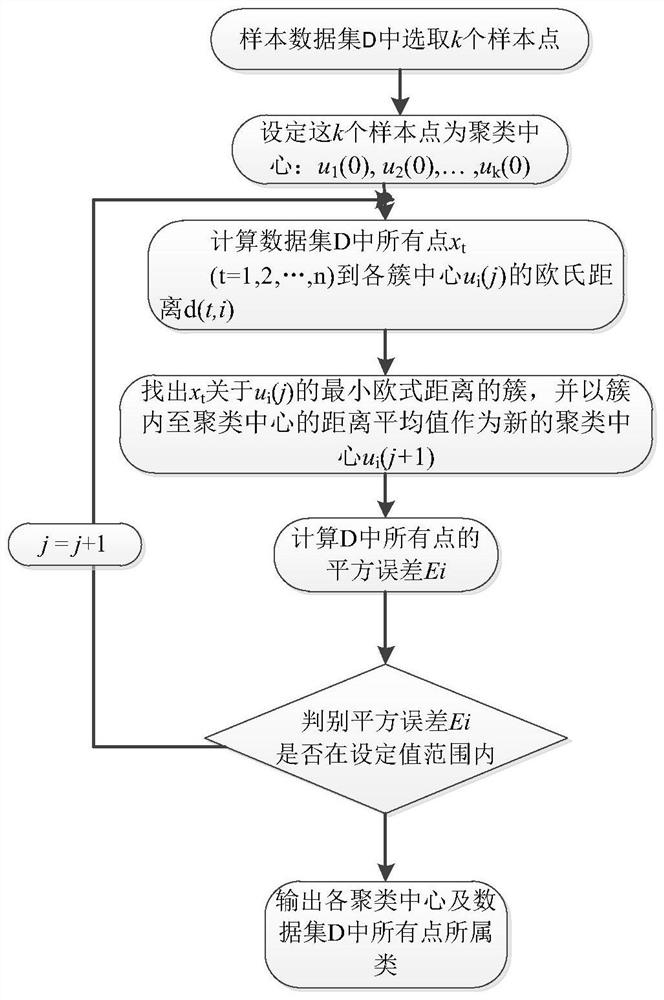
[0050] S1: Set the original power grid operation data D and the number of outliers m, standardize the data in D, and put the standardized data into the K-means++ clustering model.
[0051] It should be noted that the data in D includes node current, node voltage and load characteristic value for 24 hours.
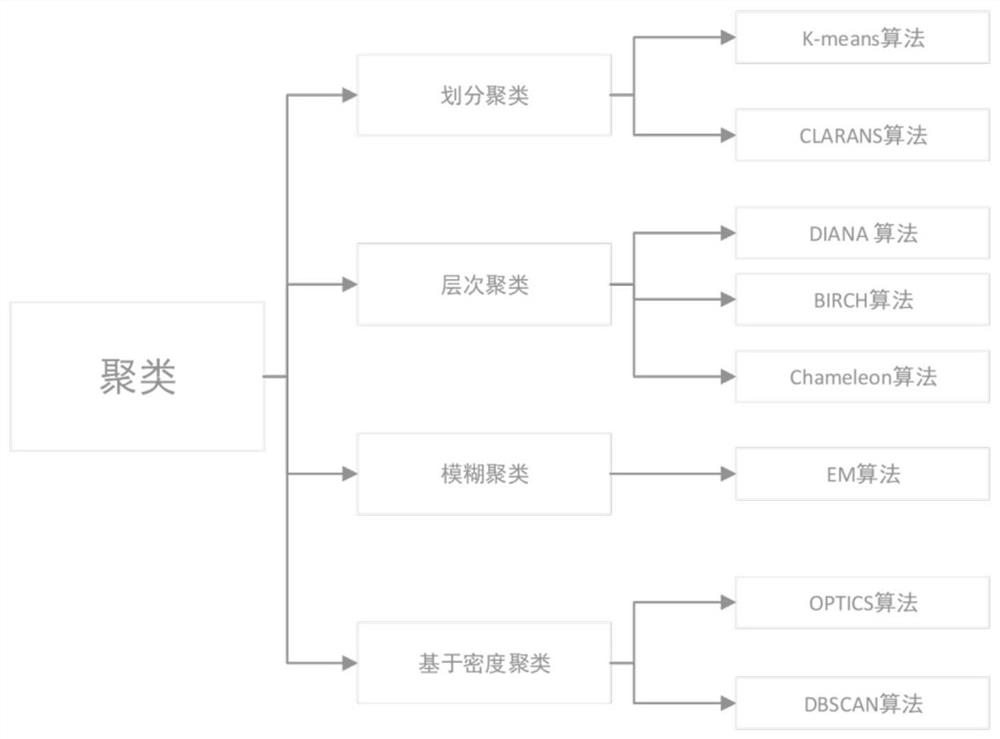
[0052] The purpose of cluster analysis is to divide the data into multiple similar classes or clusters according to the degree of similarity or dissimilarity. The principle of division is that the data in each sample are as similar as possible, while the samples of various types are as different as possible. Nevertheless, it is still necessary to provide a relatively organized description for various clustering methods, so the calculation methods based on clustering analysis mainly...
Embodiment 2
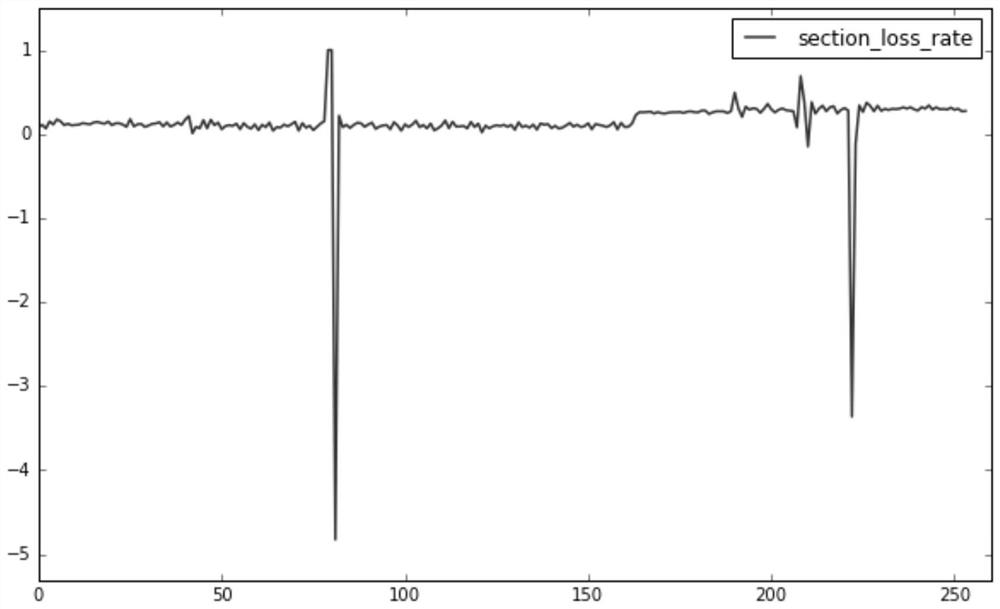
[0091] refer to Figure 6~7 It is another embodiment of the present invention, which is different from the first embodiment in that it provides a verification test of a data mining-based method for determining abnormality of distribution network operation data, in order to further improve the technical effect adopted in this method Verification shows that this embodiment adopts the method of the present invention to test, and verifies the real effect of the method by means of scientific demonstration.
[0092] according to Image 6The shown IEEE33 node 10kV distribution network frame is simulated, and the distribution network load is expanded and generated based on the annual 8760-hour load data of my country's actual power grid (24 sampling points * 365 days in a year). On this basis, the power flow of the line, the line loss rate of the whole station area, the line loss rate of each line, the node voltage, and the node current are calculated. In order to verify the practic...
PUM
 Abstract
Description
Claims
Application Information
 - R&D Engineer
- R&D Manager
- IP Professional
- Industry Leading Data Capabilities
- Powerful AI technology
- Patent DNA Extraction
Browse by: Latest US Patents, China's latest patents, Technical Efficacy Thesaurus, Application Domain, Technology Topic, Popular Technical Reports.
© 2024 PatSnap. All rights reserved.Legal|Privacy policy|Modern Slavery Act Transparency Statement|Sitemap|About US| Contact US: help@patsnap.com