
Geographical presentation method and tool for wireless data coverage area of operator

A coverage area and wireless data technology, applied in the field of network performance, can solve problems such as inability to effectively support cell processing and customer complaints, inability to visually view and obtain weak coverage areas of wireless networks, etc., to solve difficult positioning and improve processing and solution, low cost effect

Pending Publication Date: 2022-05-27
INSPUR TIANYUAN COMM INFORMATION SYST CO LTD
View PDF0 Cites 0 Cited by
  • Summary
  • Abstract
  • Description
  • Claims
  • Application Information

AI Technical Summary

Problems solved by technology

[0003] At present, most operators use coverage raster data to geographically present the coverage of wireless networks in the area. The disadvantage of this solution is that it is impossible to visually view and obtain weak coverage areas of wireless networks, and it cannot effectively support problematic cells. and customer complaints

Method used


Image

  • Geographical presentation method and tool for wireless data coverage area of operator
  • Geographical presentation method and tool for wireless data coverage area of operator
  • Geographical presentation method and tool for wireless data coverage area of operator

Examples


Embodiment 1

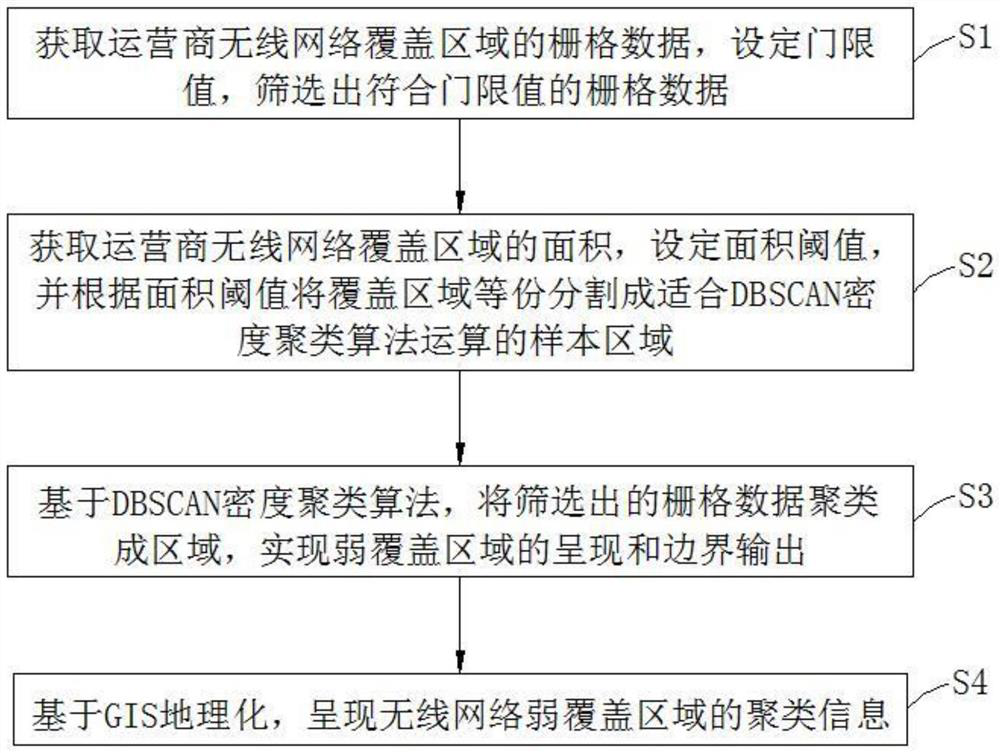
[0044] combined with figure 1 , this embodiment proposes a method for geographically presenting an operator's wireless data coverage area, including:

[0045] In step S1, grid data of the coverage area of ​​the operator's wireless network is acquired, a threshold value is set, and grid data that meets the threshold value are screened out.

[0046] In this step, the raster data of the coverage area of ​​the operator's wireless network is obtained from the Oracle database, and then the raster data that meets the threshold value is filtered out. The filtered raster data is the latitude and longitude point set data. The point set data is synchronized to the PostGIS spatial database, and the latitude and longitude point set is converted into spatial data types.

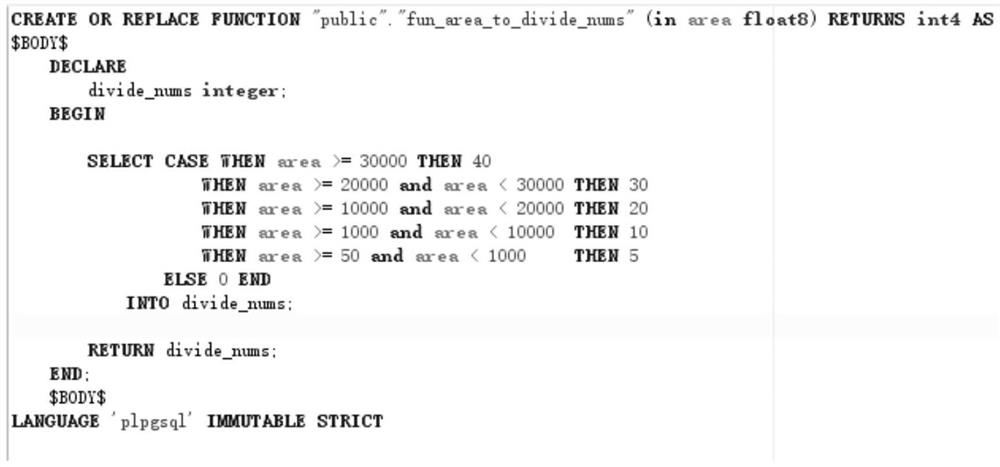
[0047] In step S2, the area of ​​the coverage area of ​​the operator's wireless network is obtained, the area threshold is set, and the coverage area is equally divided into sample areas suitable for the operation of the ...

Embodiment 2

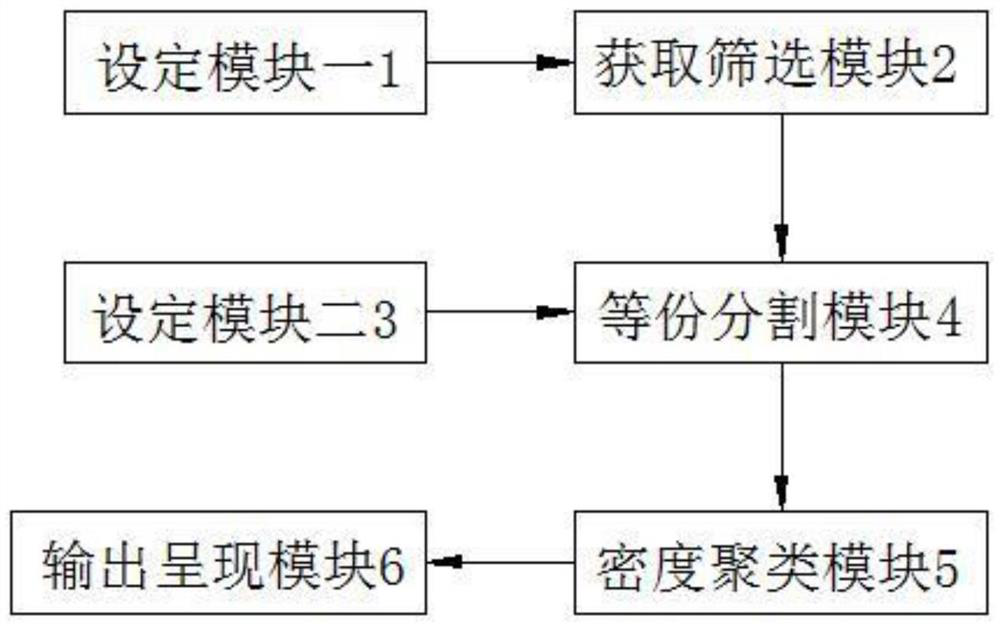
[0062] combined with figure 2 , this embodiment proposes a geographic presentation tool for an operator's wireless data coverage area, the implementation structure of which includes:

[0063] Setting module one 1 is used to set the threshold value of the grid data in the weak coverage area;

[0064] Obtaining and screening module 2 is used to obtain grid data of the coverage area of ​​the operator's wireless network, and filter the grid data according to the set threshold value;

[0065] Setting module 2 3 is used to set the area threshold;

[0066] The equal portion segmentation module 4 is used to obtain the area of ​​the coverage area of ​​the operator's wireless network, and divide the coverage area equally into sample areas suitable for the operation of the DBSCAN density clustering algorithm according to the set area threshold;

[0067] The density clustering module 5 is used to use the DBSCAN density clustering algorithm to cluster the screened grid data into regions...


PUM


Abstract

The invention discloses a method and a tool for geographically presenting a wireless data coverage area of an operator, and relates to the technical field of network performance, and the method comprises the following steps: obtaining raster data of the wireless network coverage area of the operator, setting a threshold value, and screening out the raster data conforming to the threshold value; obtaining the area of a wireless network coverage area of an operator, setting an area threshold value, and equally dividing the coverage area into sample areas suitable for DBSCAN density clustering algorithm operation according to the area threshold value; on the basis of a DBSCAN density clustering algorithm, the screened raster data are clustered into areas, and presentation and boundary output of weak coverage areas are achieved; and presenting the clustering information of the weak coverage area of the wireless network based on GIS geography. And an operator analyzes the existing network problem based on the clustering information of the weak coverage area and formulates a solution. The boundary of the weak coverage area can be presented and output, the network problem processing efficiency of operation and maintenance personnel is improved, and the problem that the weak coverage area is difficult to position is solved.

Description

technical field [0001] The invention relates to the technical field of network performance, in particular to a method and a tool for geographically presenting an operator's wireless data coverage area. Background technique [0002] Good wireless coverage is the premise to ensure the quality of mobile communication networks. In wireless network optimization, the first consideration is coverage optimization, especially for LTE networks. The performance impact is significant. [0003] At present, most operators use coverage grid data to geographically present the coverage of wireless networks in the area. The disadvantage of this solution is that it cannot intuitively view and obtain weak coverage areas of wireless networks, and cannot effectively support problem cell processing. and customer complaints. SUMMARY OF THE INVENTION [0004] Aiming at the needs and deficiencies of current technology development, the present invention provides a method and a tool for geographica...

Claims


Application Information

Patent Timeline
IPC IPC(8): G06K9/62H04W4/02H04W24/10H04L43/045
CPCH04W4/02H04W24/10H04L43/045G06F18/23213G06F18/2321Y02D30/70
Inventor 李军陈德祯
Owner INSPUR TIANYUAN COMM INFORMATION SYST CO LTD
Learn More