
Construction method of time sequence causal relationship graph

A technology of time series and causality, applied to instruments, character and pattern recognition, computer components, etc., can solve the problems of reduced accuracy of causality and misjudgment, so as to reduce misjudgment as causality and improve accuracy Effect

Pending Publication Date: 2022-04-01
SUN YAT SEN UNIV
View PDF0 Cites 2 Cited by
  • Summary
  • Abstract
  • Description
  • Claims
  • Application Information

AI Technical Summary

Problems solved by technology

[0004] In view of this, this application provides a method for constructing a time series causal relationship graph, which is used to solve a certain degree of misjudgment when calculating the causal relationship between each two time series due to the autocorrelation of time series , a defect that reduces the accuracy of causality construction

Method used


Image

  • Construction method of time sequence causal relationship graph
  • Construction method of time sequence causal relationship graph
  • Construction method of time sequence causal relationship graph

Examples


Embodiment Construction

[0053] The following will clearly and completely describe the technical solutions in the embodiments of the application with reference to the drawings in the embodiments of the application. Apparently, the described embodiments are only some of the embodiments of the application, not all of them. Based on the embodiments in this application, all other embodiments obtained by persons of ordinary skill in the art without making creative efforts belong to the scope of protection of this application.

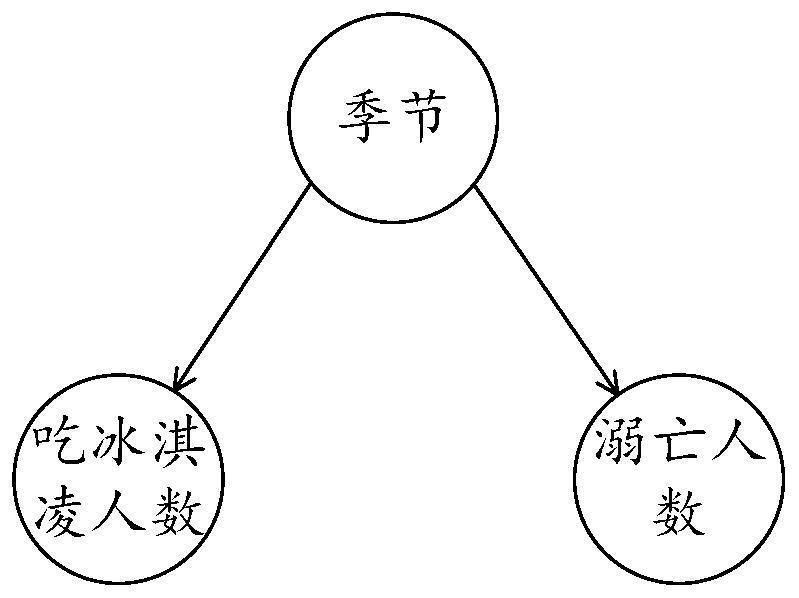
[0054] In real life, people usually rely on intuition to judge the cause and effect. For example, hot weather is the reason why ice cream is selling well. This is the most intuitive causal relationship.

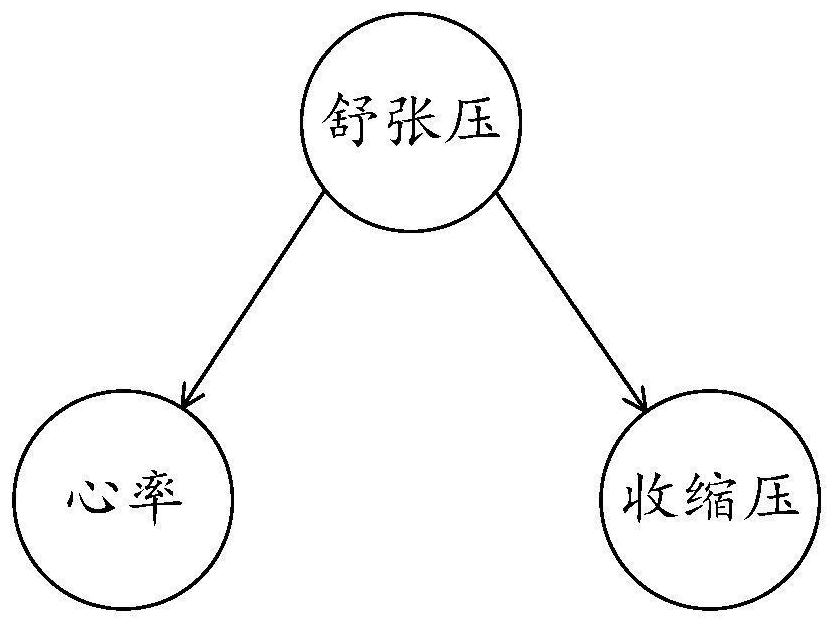
[0055] figure 1 shows a schematic diagram of causality in the field of economics, as figure 1 as shown, figure 1 Shows a causal relationship between the season, the number of people who eat ice cream, and the number of drownings. From the perspective of correlation, the number o...


PUM


Abstract

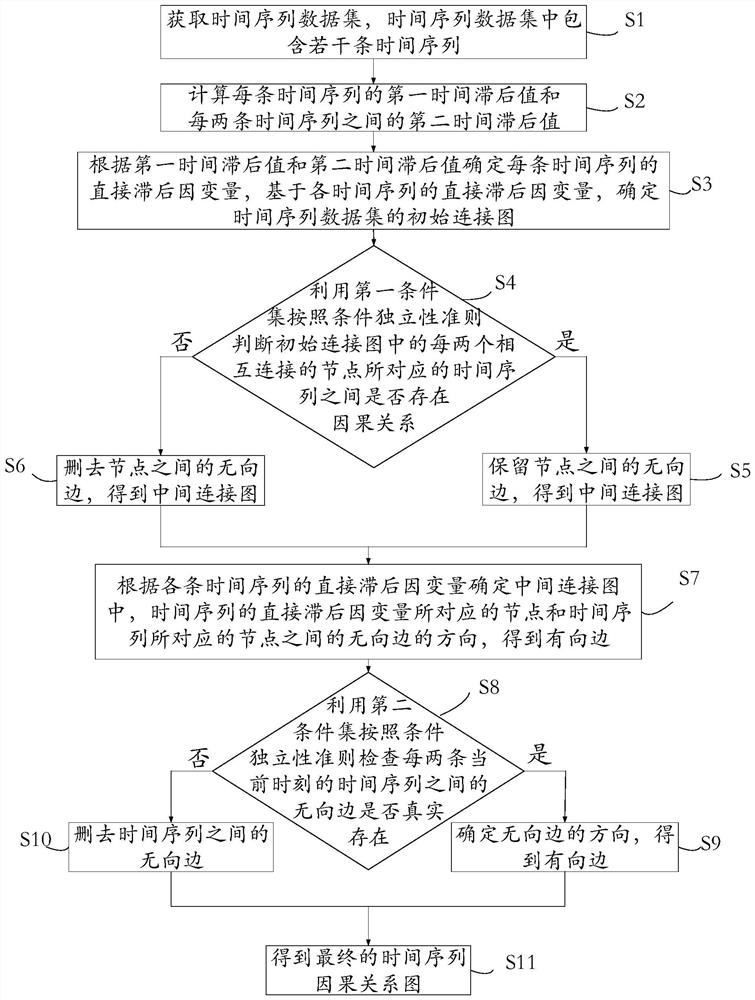
The invention discloses a method for constructing a time sequence causal relationship graph, and the method comprises the steps: calculating a first time lag value of each time sequence and a second time lag value between every two time sequences based on a plurality of time sequences; a direct lag dependent variable and an initial connection graph for each time sequence are determined. And judging whether a causal relationship exists between the time sequences corresponding to every two mutually connected nodes in the initial connection graph or not by utilizing a conditional independence criterion, thereby obtaining an intermediate connection graph. And after determining the direction of the undirected edge between the time sequences with the causal lagging relationship in the intermediate connection graph, checking whether the undirected edge between every two time sequences at the current moment actually exists or not by using the conditional independence criterion again, and obtaining a final time sequence causal relationship graph. According to the scheme, every two time sequences are fitted through the first time lag value to obtain the residual sequence, and the second time lag value is calculated by using the residual sequence, so that the accuracy of causal relationship judgment can be improved.

Description

technical field [0001] The application relates to the technical field of causal network structure learning, in particular to a method for constructing a time series causal relationship graph. Background technique [0002] With the increasing use of computers, the requirements for the safe operation of software systems are getting higher and higher. At this stage, the root cause location can be used to determine which index data in the software system is abnormal, that is, the abnormality of time series will lead to software abnormality. happened. Therefore, the construction of the causality diagram for the time series can locate the fault of the software system. In recent decades, large-scale time series data has exploded, and researchers have a wealth of data warehouses, while computing power is also growing, which opens up new ways for time series causal reasoning. [0003] In the existing methods for constructing causality of time series, due to the autocorrelation of t...

Claims


Application Information

Patent Timeline
IPC IPC(8): G06K9/62
Inventor 陈鹏飞陈楠栖郑子彬
Owner SUN YAT SEN UNIV
Learn More