Multi-band optical binary remote sensing data visualization method

A remote sensing data, binary technology, applied in still image data browsing/visualization, electrical digital data processing, still image data retrieval, etc., can solve problems such as high cost of use, achieve memory crash prevention, reduce demand, and fast and accurate conversion Effect

Active Publication Date: 2022-02-01
NO 54 INST OF CHINA ELECTRONICS SCI & TECH GRP
View PDF2 Cites 0 Cited by
  • Summary
  • Abstract
  • Description
  • Claims
  • Application Information

AI Technical Summary

Problems solved by technology

However, the image display efficiency also often depends on the performance of the GPU itself, and the purchase of powerful GPU equipment will bring users a higher cost of use.

Method used


Image

  • Multi-band optical binary remote sensing data visualization method
  • Multi-band optical binary remote sensing data visualization method
  • Multi-band optical binary remote sensing data visualization method

Examples


Embodiment Construction

[0068] In order to make the object, technical solution and advantages of the present invention clearer, the present invention will be further described in detail below in conjunction with the accompanying drawings and specific implementation steps.

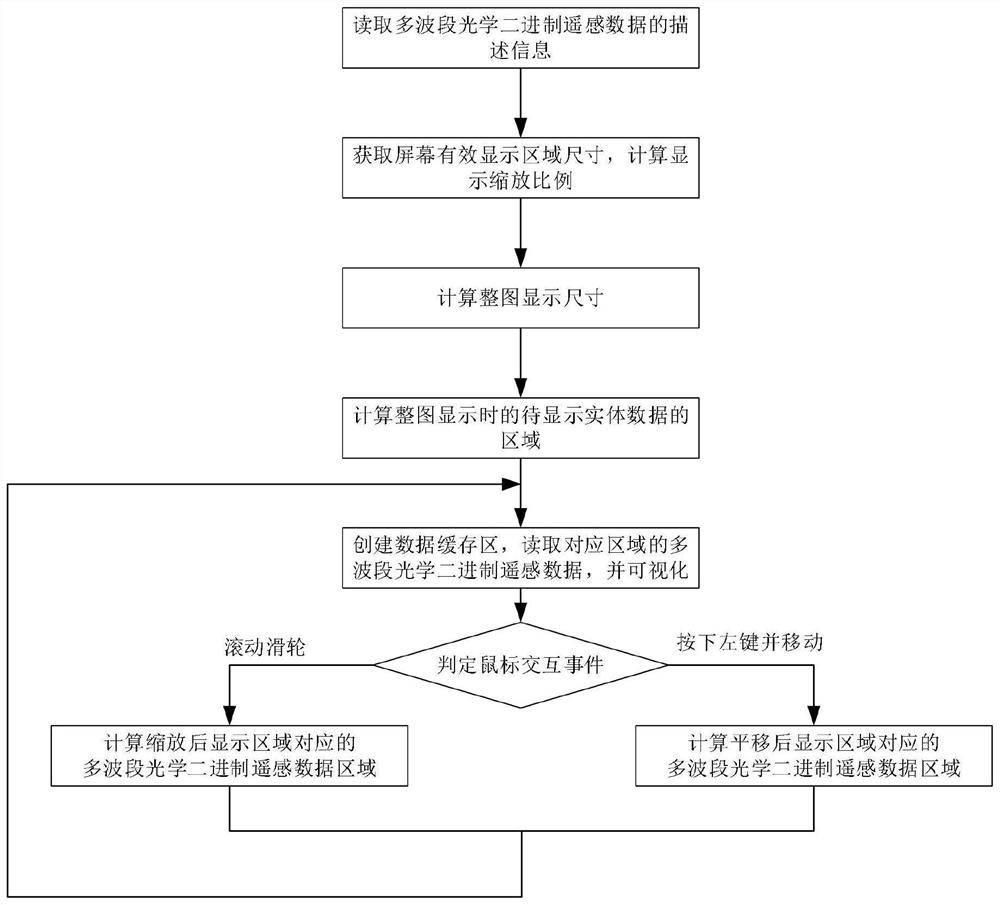
[0069] Such as figure 1 As shown, a multi-band optical binary remote sensing data visualization method specifically includes the following steps:

[0070] Step 1: Read the description information of the multi-band optical binary remote sensing data D, and obtain the data size, data type, number of bands, maximum and minimum values ​​of each band;

[0071] Step 2: According to the effective display area R of the image on the screen screen The number of horizontal pixels sw and the number of vertical pixels sh of the optical binary remote sensing data D, the number of horizontal pixels dataw and the number of vertical pixels datah of the optical binary remote sensing data D, calculate the zoom ratio α of the entire image display: ...


PUM


Abstract

The invention discloses a multi-band optical binary remote sensing data visualization method, and relates to the field of remote sensing satellite image data visualization. The method comprises the following steps of acquiring the data description information; calculating a display scaling; calculating the number of transverse and longitudinal pixels during the display of an effective display area; calculating the entity data to be displayed; creating a binary remote sensing data cache region, and performing visualization according to the display requirements; monitoring a screen mouse operation event; calculating a multi-band optical binary remote sensing data area corresponding to the display area after a remote sensing image is zoomed; and calculating a multi-band optical binary remote sensing data area corresponding to the display area after the remote sensing image is translated. According to the invention, the smooth real-time interactive display of the multi-band optical remote sensing image can be realized without very high computer hardware configuration.

Description

technical field [0001] The invention relates to the field of remote sensing satellite image data visualization, in particular to a multi-band optical binary remote sensing data visualization method. Background technique [0002] With the advancement of remote sensing imaging technology, the resolution of remote sensing images has gradually increased, and the amount of data has gradually increased. For example, the domestic Gaofen series satellites, Jilin-1 series satellites, and Gaojing-1 satellites have spatial resolutions up to or better than the sub-meter level, among which the spatial resolution of Gaojing-1 images can reach 0.5 meters. The amount of data reaches the level of several Gbytes, and the bit depth of independent channel data is usually greater than 8 bits, which cannot be directly displayed in the operating system like ordinary pictures. If you directly read the entire image file into the memory, use the CPU to perform bit-depth compression calculations, and...

Claims


Application Information

Patent Timeline
IPC IPC(8): G06F16/54G06F3/0487G06F3/0485G06F3/04845
CPCG06F16/54G06F3/0487G06F3/0485G06F3/04845
Inventor 肖阳单子力帅通梁硕薛辉
Owner NO 54 INST OF CHINA ELECTRONICS SCI & TECH GRP
Why Eureka
Try Eureka