


Quick Research
Generate reliable direction feasibility study reports for your R&D in just a few steps.

Technical Q&A
Discover and master advanced knowledge NOW. Basics, ideas, possibilities, all at once.

Find Solutions
As an expert in R&D theories, this can generate solutions to your technical problems instantly.

Evaluate Feasibility
Analyze your overall solution with one click, know your potential R&D risks in advance.

Monitor Landscape
Get weekly tech updates, stay abreast of the latest tech innovations and key insights.
Probability graph visualization method and device for defect detection
A defect detection and probability map technology, which is applied in the direction of instruments, character and pattern recognition, computer components, etc., can solve the problems of not being able to visually display the probability information of pixel defect categories, missing background category related information, etc.
- Summary
- Abstract
- Description
- Claims
- Application Information
AI Technical Summary
Problems solved by technology
Method used
Image

Examples
Embodiment 1
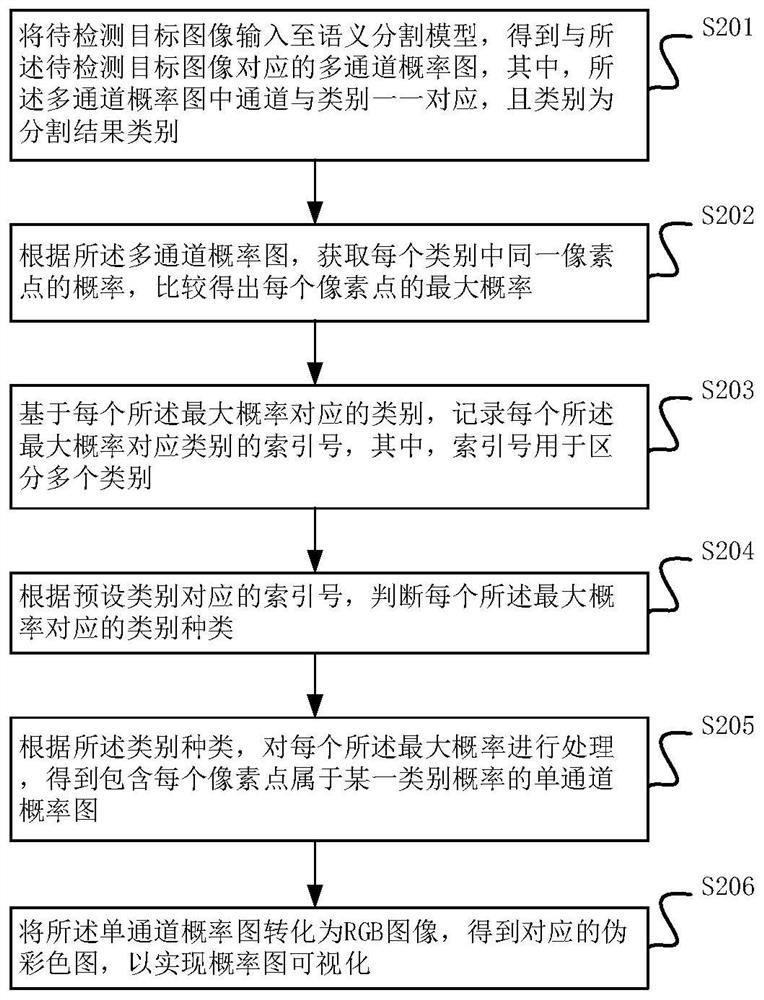
[0044] see figure 2 , a schematic flowchart of a probability map visualization method for defect detection provided in an embodiment of the present application. The method comprises the steps of:
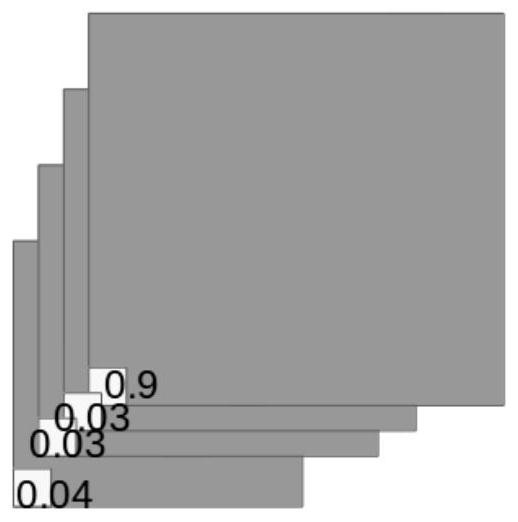
[0045] In step 201, the target image to be detected is input into the semantic segmentation model to obtain a multi-channel probability map corresponding to the target image to be detected, wherein the channels in the multi-channel probability map correspond to categories one by one, and the category is Split result categories.
[0046]In some embodiments, the semantic segmentation model is set to classify each pixel in the target image to be detected, perform image segmentation on the pixel of the defect area on the surface of the object, and the output result is a multi-channel probability map of C*H*W, wherein, C is the number of categories, H is the width of the image, and W is the height of the image, and the categories correspond to the channels in the multi-channel probabi...
Embodiment 2
[0074] Figure 8 A schematic structural diagram of the grayscale image provided by Embodiment 2 of the present application is shown.
[0075] The probability threshold is set according to the multi-channel probability map, and the detection results with low confidence are filtered out. In some embodiments, such as Figure 8 As shown, a defect is detected in the upper left corner, but the confidence of the defect is low, and the gray value is about 157. By calculating the corresponding probability (157 divided by 255 is approximately equal to 0.6), set the probability threshold to 0.6 to filter out the defect. defects.
[0076] Figure 9 A schematic structural diagram of the pseudo-color map provided in Embodiment 2 of the present application is shown.
[0077] The grayscale image is color-mapped by the color-mapping algorithm to obtain the corresponding pseudo-color image, such as Figure 9 As shown, there is an area close to the background (blue) near the right side of t...
PUM
 Abstract
Description
Claims
Application Information
 - R&D Engineer
- R&D Manager
- IP Professional
- Industry Leading Data Capabilities
- Powerful AI technology
- Patent DNA Extraction
Browse by: Latest US Patents, China's latest patents, Technical Efficacy Thesaurus, Application Domain, Technology Topic, Popular Technical Reports.
© 2024 PatSnap. All rights reserved.Legal|Privacy policy|Modern Slavery Act Transparency Statement|Sitemap|About US| Contact US: help@patsnap.com