GIS-based refined electric power weather forecast data display method and system

A technology for data display and weather forecasting, applied in structured data browsing, structured data retrieval, electrical digital data processing, etc. Improve user experience and improve display effect

Active Publication Date: 2021-08-31
STATE GRID HENAN ELECTRIC POWER ELECTRIC POWER SCI RES INST +2
View PDF7 Cites 2 Cited by
  • Summary
  • Abstract
  • Description
  • Claims
  • Application Information

AI Technical Summary

Problems solved by technology

This method can still meet the non-functional requirements of the system when analyzing and displaying the refined grid data of 30*30 km. However, with the numerical prediction of 9*9 km, 3*3 km or even 1*1 grid point data, it has gradually become the mainstream. , the display method of directly drawing grid points on the GIS map can no longer meet the fast and efficient display requirements of the power meteorological system

Method used


Image

  • GIS-based refined electric power weather forecast data display method and system
  • GIS-based refined electric power weather forecast data display method and system
  • GIS-based refined electric power weather forecast data display method and system

Examples


Embodiment Construction

[0060] The application will be further described below in conjunction with the accompanying drawings. The following examples are only used to illustrate the technical solutions of the present invention more clearly, but not to limit the protection scope of the present application.

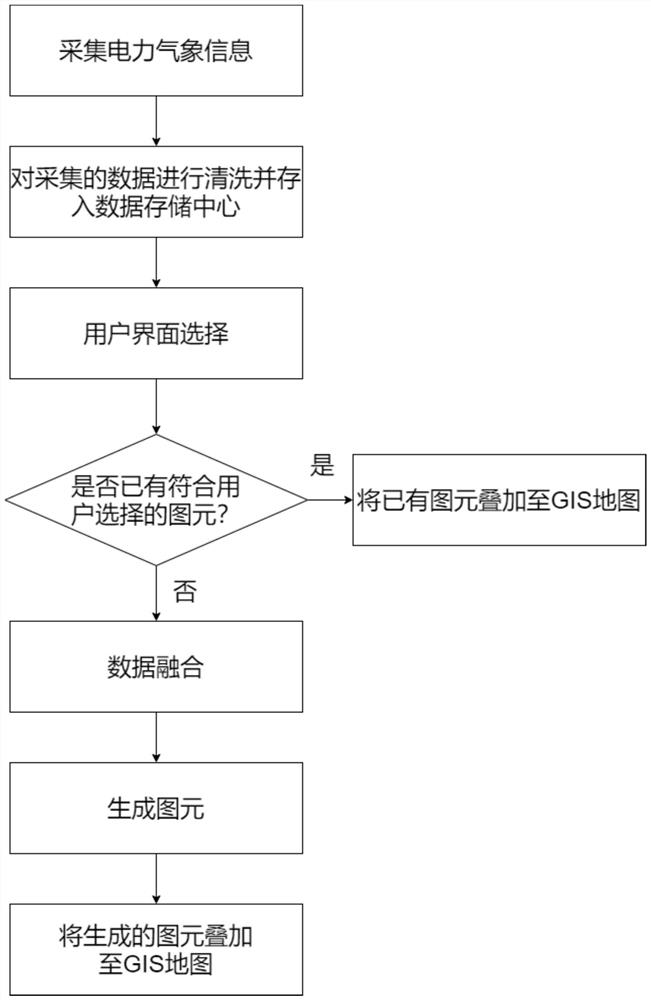
[0061] Such as figure 1 , the present invention comprises the following steps:

[0062] Step 1: Collect power meteorological information;

[0063] Power meteorological information includes power grid GIS data basic power data, basic meteorological data, and power meteorological service data.

[0064] Among them, the GIS data of the power grid includes the geographic location data of each region and route of the power grid.

[0065] The basic meteorological data includes refined weather forecast data, radar data, lightning location data and GIS data corresponding to these data; the refined weather forecast data includes short-term weather forecast data, medium-term weather forecast data and ensem...


PUM


Abstract

The invention discloses a GIS-based refined electric power weather forecast data display method and system. The method comprises the steps of 1, collecting electric power weather information; 2, cleaning the collected data and storing the data into a data storage center; 3, according to the selection of the user, searching whether a generated primitive meeting the selection of the user exists on the server, if so, directly calling the primitive and superposing the primitive on the GIS map to complete data display, and if not, entering the step 4; 4, extracting data in the corresponding data storage center according to the user selection area for data fusion; 5, generating corresponding primitives according to the fused data and outputting the primitives to a server; and 6, superposing the generated primitives on the GIS map. The system disclosed by the invention is based on the method. According to the method and the system, a data fusion algorithm and a method for repeatedly utilizing the primitives drawn before can greatly improve the display effect and the display efficiency of the refined numerical forecasting data on the GIS map, and the user experience is effectively improved.

Description

technical field [0001] The invention belongs to the field of power meteorological data display, and in particular relates to a GIS-based refined power weather forecast data display method and system. Background technique [0002] With the continuous development of distributed new energy, especially the large-scale popularization and application of wind power and photovoltaic power generation, the sensitivity of electricity to weather changes is getting higher and higher, and the impact of weather changes on power load demand is increasing. Improved weather forecasts are essential. [0003] In recent years, my country's meteorological forecast has continued to move towards refinement. The main product is precise weather forecast with refined numerical forecast as the technical core. At the same time, the rapid development of power grid digitization has made the acquisition of basic data of the power grid more and more abundant and accurate, which has laid a data foundation f...

Claims


Application Information

Patent Timeline
Patent Type & Authority Applications(China)
IPC IPC(8): G06F16/29G06F16/26G06F16/215
CPCG06F16/29G06F16/26G06F16/215Y04S10/50
Inventor 王超李哲王津宇卢明梁允姚德贵周宁郭志民刘善峰王磊李帅杨磊苑司坤高阳崔晶晶马建伟耿俊成吕卓陈岑刘莘昱张小斐刘昊杨文
Owner STATE GRID HENAN ELECTRIC POWER ELECTRIC POWER SCI RES INST
Why Eureka
Try Eureka