
Power consumption time sequence data visualization display method and system and readable medium

A time-series data, time-series technology, applied in visual data mining, system integration technology, data processing applications, etc., can solve problems such as the inability to monitor and predict power consumption in real time, the impact of user enterprises, and the inability of enterprises to produce normally. Reduce the probability of power instability and tripping, improve efficiency, and simplify the effect of topology display

Active Publication Date: 2021-07-23
内蒙古电力(集团)有限责任公司乌兰察布供电分公司
View PDF18 Cites 1 Cited by
  • Summary
  • Abstract
  • Description
  • Claims
  • Application Information

AI Technical Summary

Problems solved by technology

[0003] At present, the overall power consumption in some areas of the country is insufficient, and traditional manual regulation cannot monitor and predict power consumption in real time. When the total power consumption in the peak period exceeds the maximum power supply load in the area, a sudden trip may occur. Leading to the inability of the enterprise to produce normally
The existing power monitoring system usually adjusts the power consumption in the power grid after tripping, which has a certain hysteresis, and a sudden power failure will also have a great impact on the user enterprise, so there is an urgent need for a system that can monitor the power consumption in advance. Power distribution to avoid tripping monitoring system

Method used


Image

  • Power consumption time sequence data visualization display method and system and readable medium
  • Power consumption time sequence data visualization display method and system and readable medium
  • Power consumption time sequence data visualization display method and system and readable medium

Examples


Embodiment 1

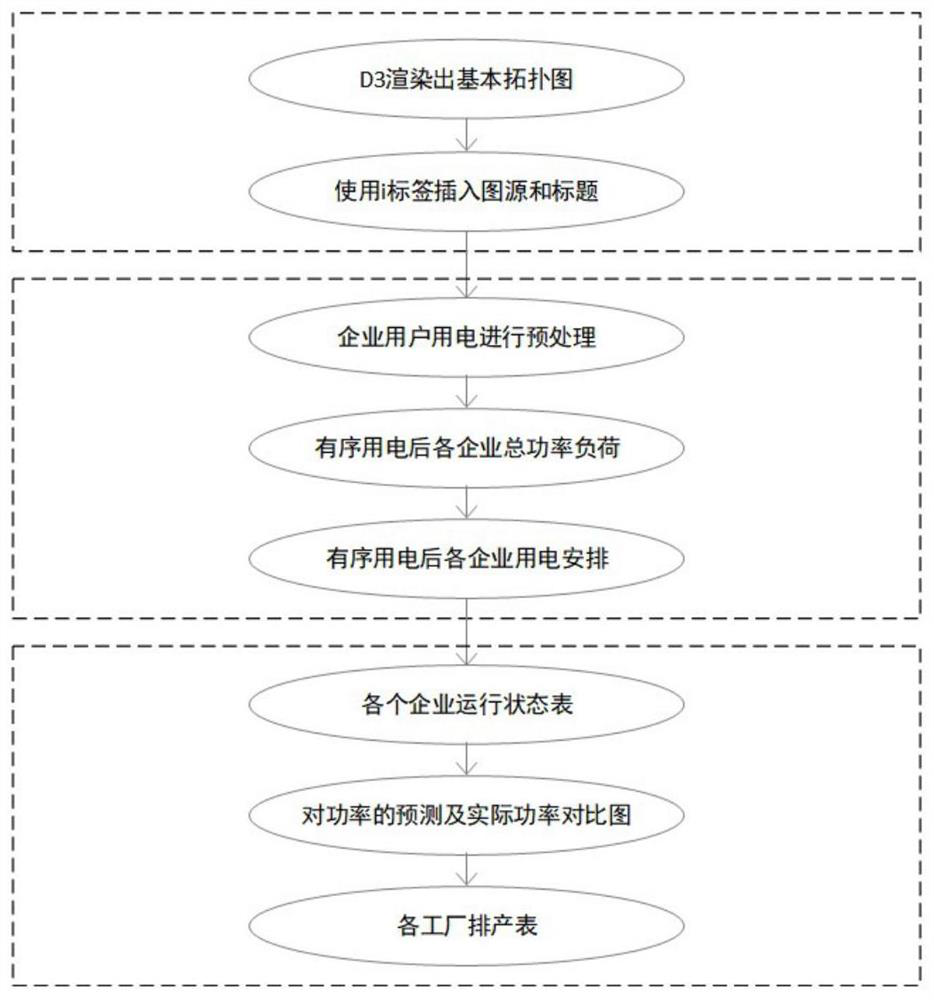
[0028] This embodiment discloses a method for visually displaying power consumption sequence data, such as figure 1 shown, including the following steps:

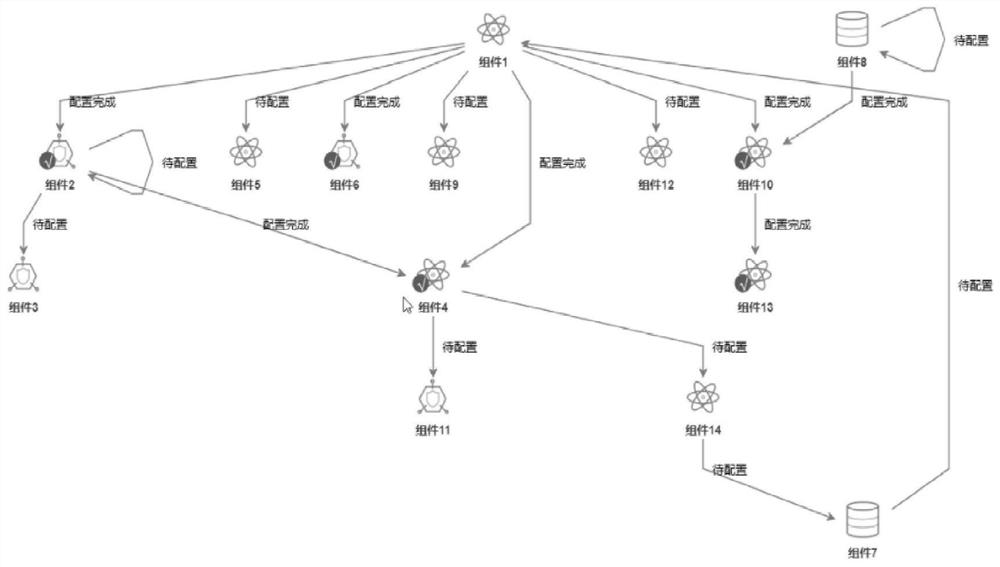
[0029] S1 generates the topological structure of users in the power grid based on the historical power consumption of users. The generated topology is as follows: figure 2 shown.

[0030] The method for generating the topology structure in step S1 is: using VUE and D3 to automatically generate the topology diagram on the Web side, such as figure 2 The topology shown. The full name of D3 is Data Drive Document, which means to operate Document (file) through Data (data). When doing data visualization, the most common Drive (driver) of Data (data) is SVG (Scalable Vector Graphics). Scalable Vector Graphics). The specific operation method is: use dagre-d3 to render the initial topology structure, replace the content displayed in each node in the initial topology structure with i tags, insert corresponding data in each i t...

Embodiment 2

[0043] Based on the same inventive concept, this embodiment discloses a visual display system for power consumption sequence data, including:

[0044] The topology generating module is used to generate the topology of the users in the power grid according to the historical power consumption of the users;

[0045] The model building module is used to establish a power consumption sequence calculation model according to the topology structure, which is used to reasonably allocate the power consumption of each user in each time period, and generate the total active power curve of the user after reasonable distribution;

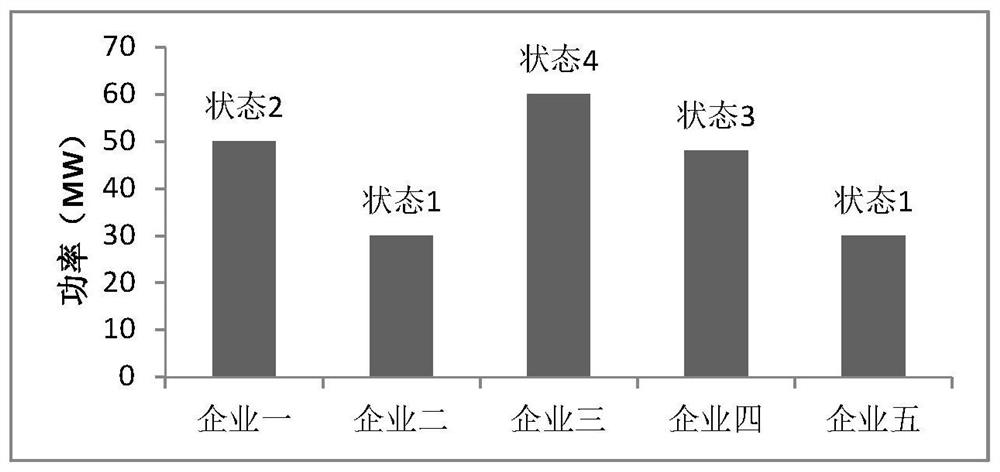
[0046] The chart generation module is used to obtain the reasonable power consumption of each user according to the total active power curve, and generate the operating state chart, power consumption and power comparison chart of each user;

[0047] The display module is used to display the running state diagram, power consumption and power comparison diagram, an...

Embodiment 3

[0049] Based on the same inventive concept, this embodiment discloses a computer-readable storage medium storing one or more programs, one or more programs include instructions, and the instructions, when executed by a computing device, cause the computing device to execute any one of the above-mentioned A visual display method of power consumption time series data of items.

[0050] Those skilled in the art should understand that the embodiments of the present application may be provided as methods, systems, or computer program products. Accordingly, the present application may take the form of an entirely hardware embodiment, an entirely software embodiment, or an embodiment combining software and hardware aspects. Furthermore, the present application may take the form of a computer program product embodied on one or more computer-usable storage media (including but not limited to disk storage, CD-ROM, optical storage, etc.) having computer-usable program code embodied there...


PUM


Abstract

The invention belongs to the field of data visualization analysis, and relates to a power consumption time sequence data visualization display method and system and a readable medium, and the method comprises the following steps: S1, generating a topological structure of a user in a power grid based on the historical power consumption of the user; S2, according to the topological structure, establishing a power consumption time sequence calculation model for reasonably distributing the power consumption of each user in each time period, and generating a total active power curve of the users after reasonable distribution; S3, obtaining reasonable electricity consumption of each user according to the total active power curve, and generating an operation state diagram and an electricity consumption and power comparison diagram of each user; and S4, displaying the running state diagram, the electricity consumption and the power comparison diagram, and reminding the user exceeding the electricity consumption according to the electricity consumption distribution result in the step S2. The power consumption of users in a power grid can be adjusted in advance, the probability of electric quantity instability and tripping is reduced, and meanwhile the electric energy consumption efficiency is improved.

Description

technical field [0001] The invention relates to a visual display method, system and readable medium of time series data of electricity consumption, belonging to the field of data visualization analysis, in particular to the field of power data visualization management. Background technique [0002] With the development of my country's economy, the power consumption is also increasing, and there will often be insufficient power supply during the peak period of power consumption. If only by increasing the total installed capacity to meet the peak electricity demand, not only will the input cost be increased, but also the efficiency of electric energy consumption will be relatively low. [0003] At present, the overall power consumption in some areas of the country is insufficient, and traditional manual regulation cannot monitor and predict power consumption in real time. When the total power consumption in the peak period exceeds the maximum power supply load in the area, a s...

Claims


Application Information

Patent Timeline
IPC IPC(8): G06F16/26G06F30/27G06Q10/06G06Q50/06
CPCG06F16/26G06F30/27G06Q10/0631G06Q50/06Y04S10/50Y02E40/70Y02D10/00
Inventor 陈辰范建泽臧鹏程王强
Owner 内蒙古电力(集团)有限责任公司乌兰察布供电分公司
Learn More