Price analysis method

An analysis method and price technology, applied in the field of price analysis of financial product prices, can solve the problems of not being able to prompt clear buying and selling points, difficult to get started with theory, and difficult to analyze, so as to improve the efficiency of capital use, rapid analysis and accurate quantitative analysis and analysis. Intuitive results

Pending Publication Date: 2021-05-28
自渡科技(北京)有限公司
View PDF0 Cites 0 Cited by
  • Summary
  • Abstract
  • Description
  • Claims
  • Application Information

AI Technical Summary

Problems solved by technology

[0005] To sum up, the existing price analysis methods generally have shortcomings such as inability to prompt clear buying and selling points, huge amount of data to be processed, high difficulty in analysis, and difficulty in getting started with advanced theories.

Method used


Image

  • Price analysis method
  • Price analysis method
  • Price analysis method

Examples


Embodiment Construction

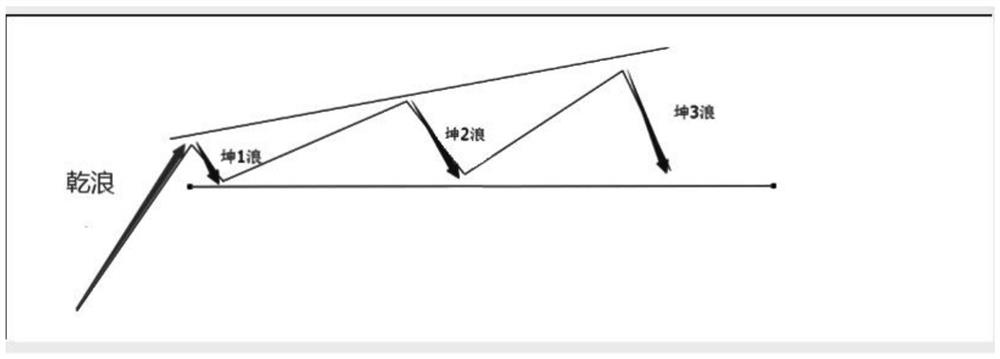
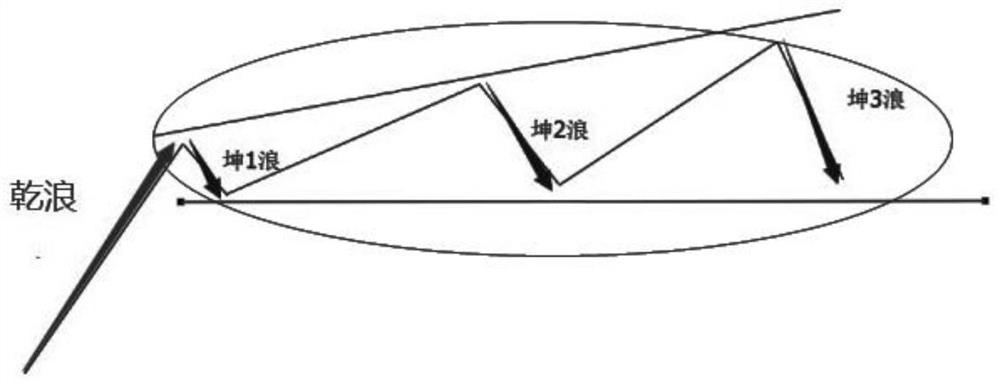
[0036] In order to introduce the price analysis method according to the embodiment of the present invention, the inventor takes China A shares as an example for illustration. Moreover, the following two restrictions are made: first, since investors invest in stocks to earn price difference income, and China's A-shares are mainly long-term markets, so in the embodiment, the situation of rising stock prices is mainly selected for analysis. Of course, The price analysis method of the embodiment of the present invention is also applicable to the situation that the stock price falls. Second, since the current minimum price change of China's A-shares is 0.01 yuan, the terms greater or less than mentioned in this manual are bounded by greater than or less than 0.01 yuan.

[0037] The main analysis basis of the price analysis method according to the embodiment of the present invention is the rising range and adjustment (decreasing) range of the price (mainly referred to as K-line in t...


PUM


Abstract

The invention discloses a price analysis method for analyzing trends of financial products such as stocks and futures. The price analysis method comprises the following steps: an analysis range selection step: selecting financial products needing to be analyzed and selecting a required analysis range from a price trend chart of the financial products; a step of searching a staged lowest point: searching the staged lowest point from the analysis range; a step of searching a first maximum adjustment amplitude point: searching the first maximum adjustment amplitude point after the stage lowest point from the analysis range; a qian wave and kun wave identification step: identifying qian waves and kun waves in the analysis range; and an analysis step: performing price analysis according to the identification results of the qian waves and the kun waves in the step of identifying the qian waves and the kun waves. Moreover, according to the price analysis method, quantitative analysis can be carried out by using a formula, so that a buying point and a selling point are clear.

Description

technical field [0001] The invention relates to the technical field of data mining and analysis, in particular to a price analysis method for analyzing prices of financial products such as stocks and futures. Background technique [0002] The price analysis in the stock and futures markets is mainly realized through K-line analysis. The K-line chart contains four data, namely the opening price, the highest price, the lowest price, and the closing price. These four data are used to draw the K-line chart to reflect Fluctuations in market prices. Use one day's price data to draw a K-line chart, and you can get a daily K-line chart. Similarly, if you use one-minute price data to draw a K-line chart, it is called a one-minute K-line chart; use a week's price data to draw a K-line chart. Drawing a K-line chart is called a weekly K-line chart; drawing a K-line chart with one month's data is called a monthly K-line chart. The drawing period can be flexibly selected according to th...

Claims


Application Information

Patent Timeline
Patent Type & Authority Applications(China)
IPC IPC(8): G06Q40/04G06Q30/02
CPCG06Q30/0206G06Q40/04
Inventor 戴启坤
Owner 自渡科技(北京)有限公司
Why Eureka
Try Eureka