Step-by-step linear aggregation rainfall data scale conversion method

A technology for rainfall data and scale conversion, applied in data processing applications, instruments, forecasting, etc., can solve the problems of data having no practical value and models that cannot be directly applied, and meet the requirements of solving sparse problems, reducing the number of links, and improving efficiency effect

Active Publication Date: 2021-04-16
HOHAI UNIV
View PDF6 Cites 1 Cited by
  • Summary
  • Abstract
  • Description
  • Claims
  • Application Information

AI Technical Summary

Problems solved by technology

However, the rainfall obtained by microwave link monitoring is in the form of line aggregation, that is, the non-linear weighted average of the rainfall intensity passing through the link, which conceals the real point monitoring information and makes the collected data useless; On the other hand, the input of existing models is mostly point data, and the modeling assumption in the form of line aggregation has no physical meaning, so theoretically it cannot be directly applied to the model

Method used


Image

  • Step-by-step linear aggregation rainfall data scale conversion method
  • Step-by-step linear aggregation rainfall data scale conversion method
  • Step-by-step linear aggregation rainfall data scale conversion method

Examples


Embodiment 1

[0043] Embodiment 1: The lowest level is the case of a non-level 1 link.

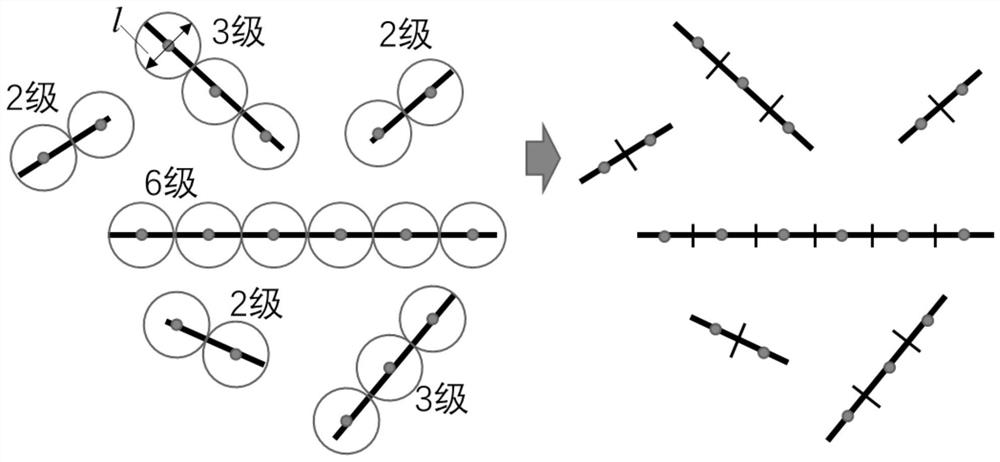
[0044] In the first step, the site control range l is given;

[0045] In the second step, the length L of each link is divided by the control range l and rounded to obtain the level of each link, such as figure 1 Shown can be cut with a circle of radius l, in the appendix figure 1 Among them, the lengths of the 6 links are divided by 1, and 3 2-level links, 2 3-level links, and 1 6-level link are obtained;

[0046] The third step is to discretize the links according to the classification results, divide the links equally according to the link level, and take the center point of each segment link after equal division as the virtual rainfall station, as shown in figure 1 As shown, the level 3 link is divided into 3 equal parts, and the focus of the segment is the virtual site;

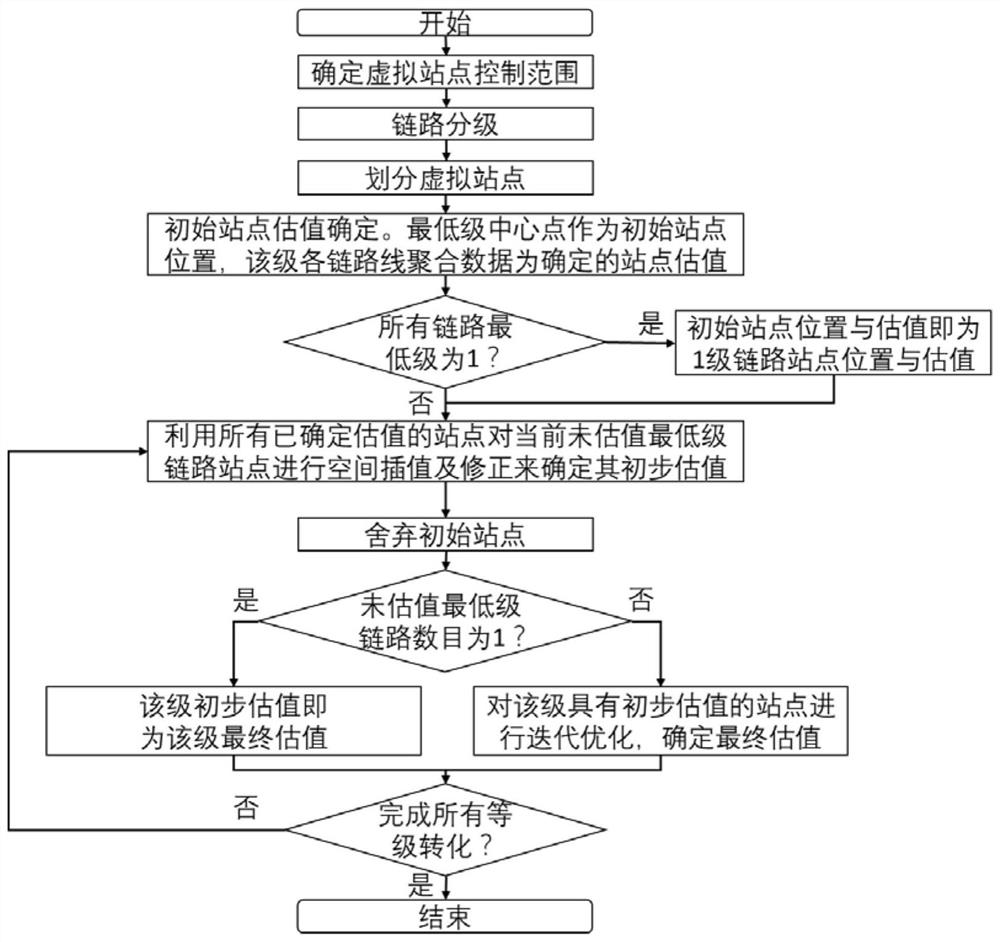
[0047] The fourth step is to determine the initial site location and valuation. Since there is no level 1 link, the middle p...

Embodiment 2

[0063] Embodiment 2: The lowest level is a level 1 link situation.

[0064] If there are level 1 links that meet the quantity requirements, then:

[0065] In the first step, the site control range l is given;

[0066] In the second step, the length L of each link is divided by the control range l and rounded to obtain the level of each link;

[0067] The third step is to discretize the links according to the classification results, divide the links equally according to the link level, and take the center point of each segment link after equal division as the virtual rainfall station;

[0068] The fourth step is to determine the initial site location and valuation. Since the lowest level is level 1, the center points of all level 1 links are taken as the initial site location, the aggregated data of each link line at this level is the definite site estimate, and the value of the initial site is the final estimate of the level site;

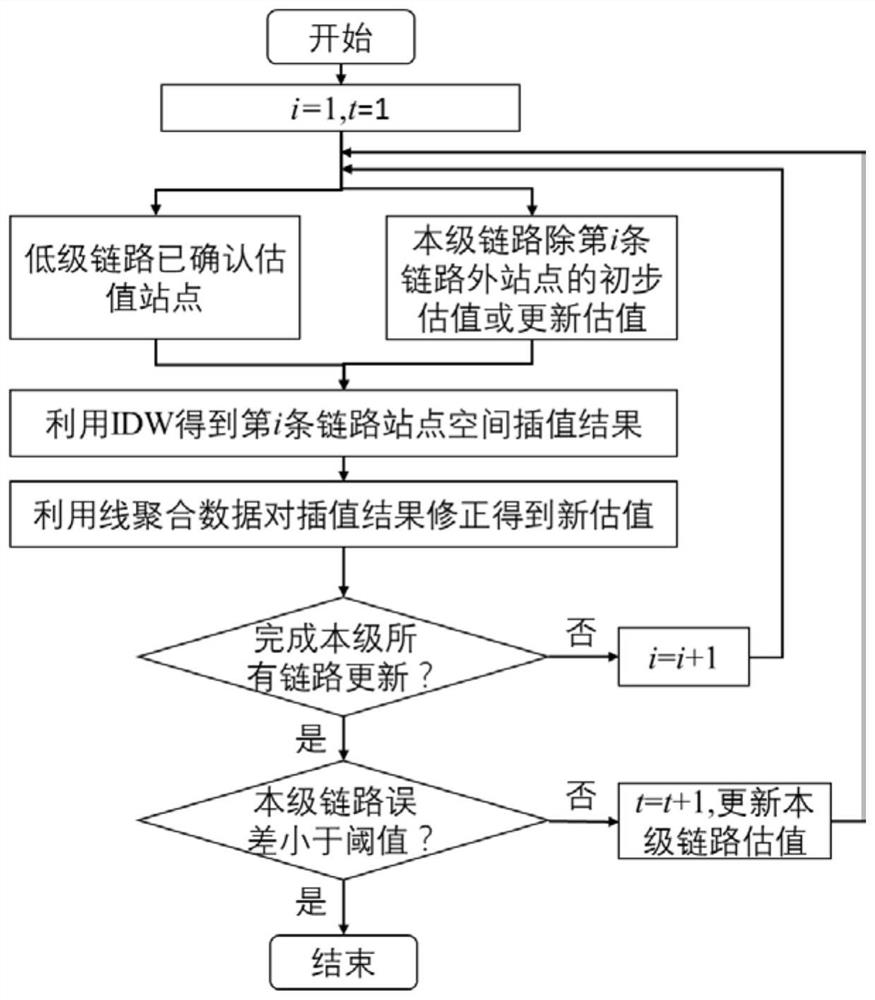
[0069] The fifth step is the preliminary ...


PUM


Abstract

The invention discloses a step-by-step linear aggregation rainfall data scale conversion method. The method comprises the following steps: giving a station control range l; grading the ith link according to the length Li of the ith microwave link in the microwave network; discretizing the link according to the grading result, equally dividing the link according to the link grade, and taking the equally divided link center point of each segment as a virtual rainfall station; determining an initial station position and an estimated value; determining the preliminary estimation value of the unestimated virtual station with the lowest level; obtaining a link of the preliminary estimation value to carry out iterative optimization; and entering the next level of link calculation, and repeating until the calculation of all levels of links is completed. According to the concept of grading and step-by-step optimization provided by the invention, the problem that all links fall into a local optimal solution can be effectively avoided; the step-by-step optimization can effectively reduce the influence of large errors in the long-chain route aggregation data on the conversion process, and improves the precision of the conversion result while guaranteeing the convergence rate of the algorithm.

Description

technical field [0001] The invention relates to a step-by-step line aggregation rainfall data scale conversion method, which belongs to the field of meteorological data processing. Background technique [0002] Regional rainfall monitoring using ground microwave communication network is a new emerging technology in recent years. Compared with traditional technology, this technology has many advantages such as saving construction cost, covering a wide area, and having a high degree of refinement. However, the rainfall obtained by microwave link monitoring is in the form of line aggregation, that is, the non-linear weighted average of the rainfall intensity passing through the link, which conceals the real point monitoring information and makes the collected data useless; On the other hand, the input of existing models is mostly point data, and the modeling assumption in the form of line aggregation has no physical meaning, so theoretically it cannot be directly applied to th...

Claims


Application Information

Patent Timeline
IPC IPC(8): G06Q10/04G06Q50/26
Inventor 郑鑫杨涛陈志远洪岱师鹏飞秦友伟
Owner HOHAI UNIV
Why Eureka
Try Eureka