
Processing method for presenting data index hierarchies and classifications in spreadsheet

A processing method and spreadsheet technology, applied in the field of big data processing, can solve problems such as the difficulty of expressing the combination method clearly, it is difficult to form a unified indicator library, and the inability to express, so as to achieve diversified, easy-to-understand, and accurate presentation of results. Effect

Active Publication Date: 2021-03-12
HEBEI INST OF SCI & TECH INFORMATION HEBEI INST OF SCI & TECH INNOVATION STRATEGY
View PDF10 Cites 0 Cited by
  • Summary
  • Abstract
  • Description
  • Claims
  • Application Information

AI Technical Summary

Problems solved by technology

Most of the new indicators formed by the direct combination of XY (or YX) in this way are not standard (or conventional) indicators, and have many defects such as too long indicator names, irregularities, inaccuracies, poor readability, and ambiguity. When there are multiple layers of superior-subordinate or containment relationships, this combination is difficult to express clearly or cannot be expressed at all
Especially in the process of multi-source data fusion, the indicators formed in this way are difficult to form a unified indicator library, and it is also not conducive to large-scale combination operations of data and mining of implicit information such as the relationship between indicators. Realize the needs of on-demand display and flexible combination

Method used


Image

  • Processing method for presenting data index hierarchies and classifications in spreadsheet
  • Processing method for presenting data index hierarchies and classifications in spreadsheet
  • Processing method for presenting data index hierarchies and classifications in spreadsheet

Examples


Embodiment Construction

[0037] The present invention will be further described in detail below in conjunction with the accompanying drawings and specific embodiments.

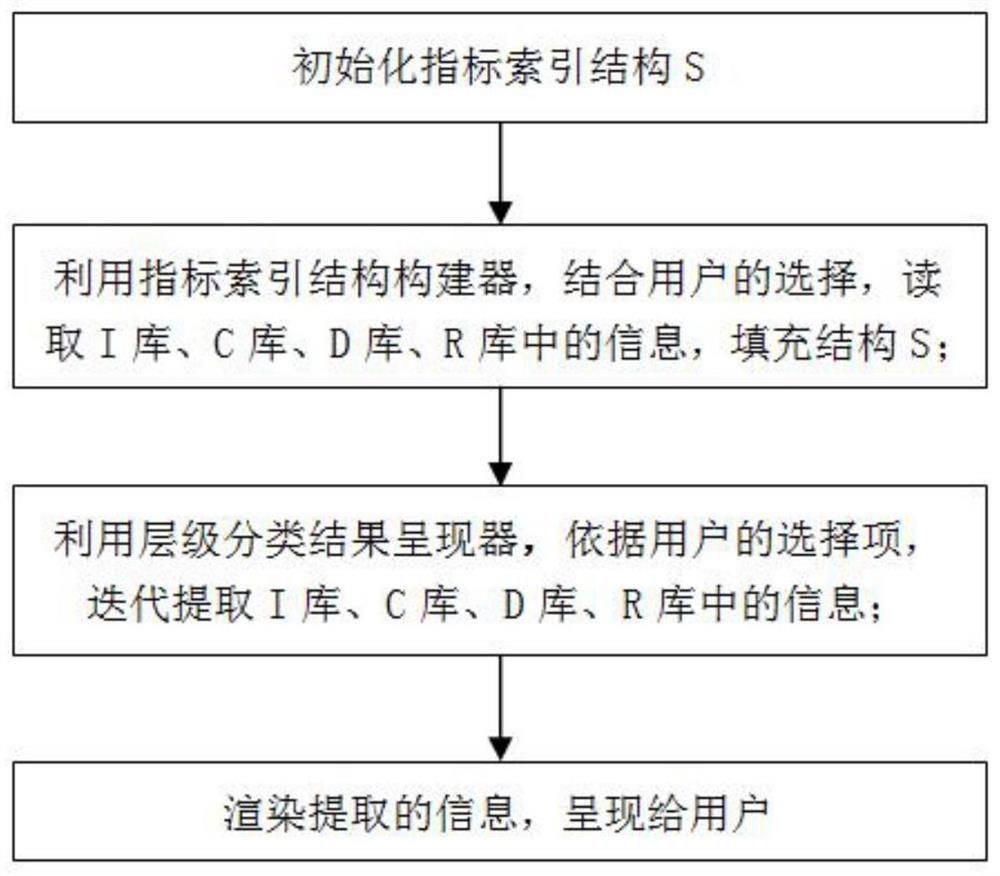
[0038] A processing method for presenting data index levels and classifications in a spreadsheet, the processing method is implemented based on calling the data with its own attributes, by constructing an index index structure, and according to the user's personalized selection, numerical items are presented in the form of a spreadsheet, and The indicators and levels corresponding to the values, the category descriptions and levels of indicators, the application scenarios and other hidden attributes of indicators and indicator category descriptions, realize the accurate expression of two-dimensional tabular data.

[0039] The data in the two-dimensional table of the present invention includes characteristic data, noun data, classification data and statistical data. After the data is granulated, it contains the value of its own attribu...


PUM


Abstract

The invention discloses a processing method for presenting data index hierarchies and classifications in a spreadsheet, and the method comprises the steps: building an index index structure S, presenting indexes and hierarchies, index classification description and hierarchies, application scenes of index and index classification description and other implicit attributes in a spreadsheet mode according to the personalized selection of a user, so that index expression is simpler, readability is higher, accurate expression of two-dimensional table data can be achieved, and a presented table is easier to understand. And on the basis, indexes and index classification description can be flexibly and variously combined and displayed, so that the displayed result is more diversified, flexible andpersonalized.

Description

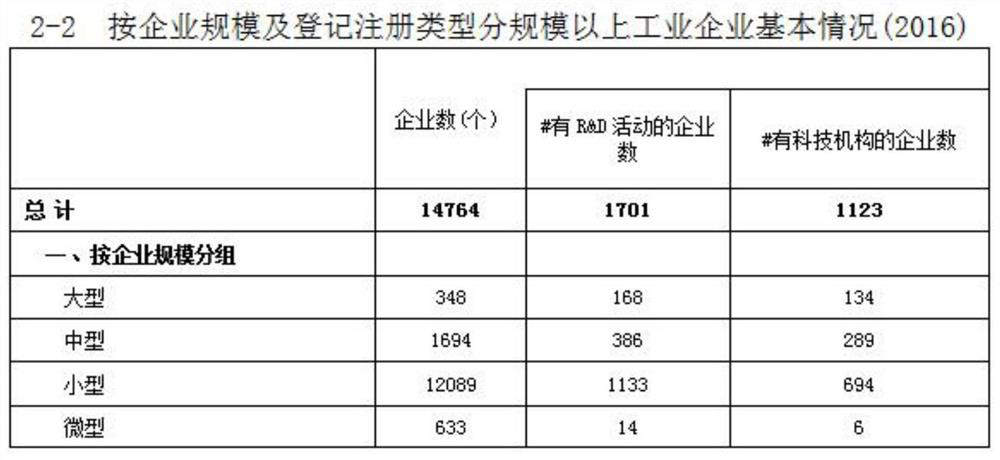
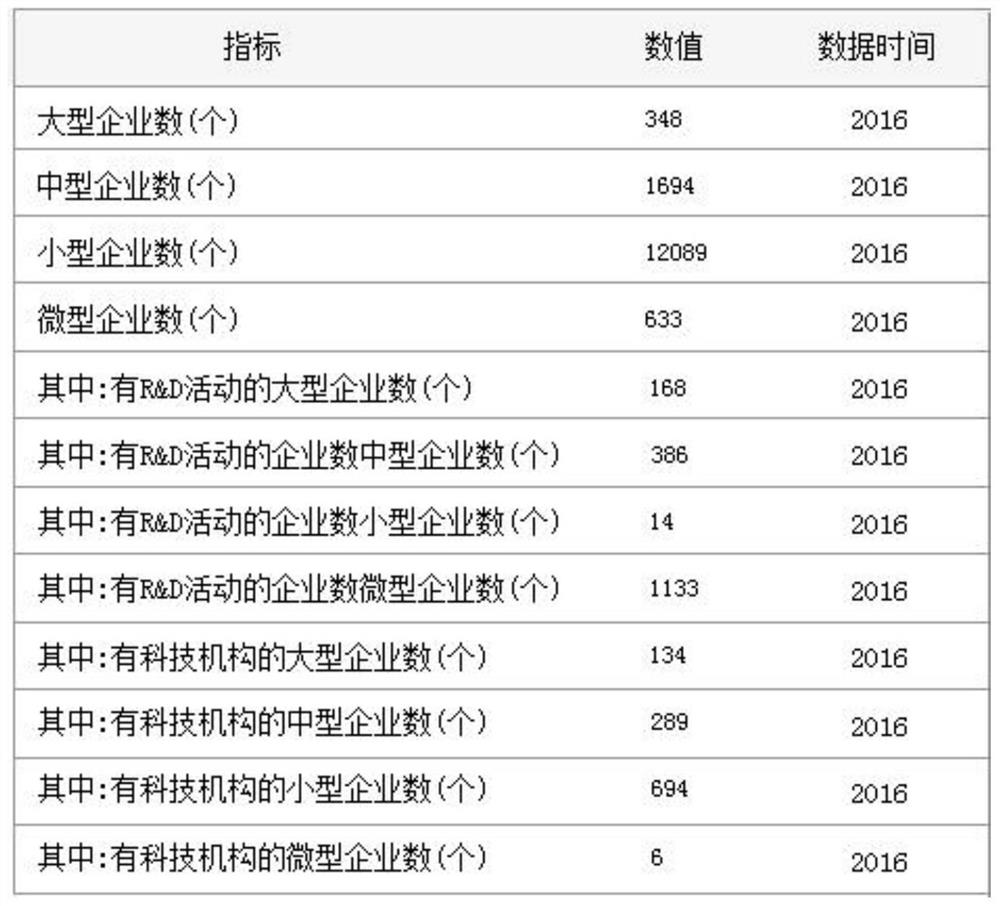
technical field [0001] The invention belongs to the technical field of big data processing, in particular to a processing method for presenting data index levels and classifications in an electronic form. Background technique [0002] In the process of big data governance, the sources of data are diverse, and tabular data files are one of the common types. [0003] Most of the existing statistical data are presented in the form of two-dimensional tables. The actual meaning represented by each value in the table needs to be understood in combination with the title of the table and the indicators corresponding to the horizontal and vertical coordinates of the value, such as figure 1 In , the indicator area of ​​the table can be divided into X coordinate area and Y coordinate area, that is, the indicators of the X coordinate area are "number of enterprises (units)", "#number of enterprises with R&D activities", "#number of enterprises with scientific and technological instituti...

Claims


Application Information

Patent Timeline
Patent Type & Authority Applications(China)
IPC IPC(8): G06F16/28G06F16/22
CPCG06F16/2282G06F16/285G06F16/2246G06F40/18G06F40/137G06F3/04842
Inventor 李银生吴峰张朝宗聂永川王红任雁刘淼张金龙陈娟张碟蒋倩男张聪高原高银珍毋鹏杰
Owner HEBEI INST OF SCI & TECH INFORMATION HEBEI INST OF SCI & TECH INNOVATION STRATEGY
Learn More