A Visualization Method of Ocean Primary Productivity Distribution Based on RS

A primary productivity, marine technology, applied in the direction of analytical materials, instruments, special purpose ships, etc., can solve problems such as changing elements

Active Publication Date: 2021-05-04
SOUTH CHINA SEA FISHERIES RES INST CHINESE ACAD OF FISHERY SCI
View PDF30 Cites 0 Cited by
  • Summary
  • Abstract
  • Description
  • Claims
  • Application Information

AI Technical Summary

Problems solved by technology

[0004] There are also some technical solutions for measuring marine primary productivity in the prior art, such as a Chinese patent with application number 2015208493914, which discloses a simulated on-site cultivation device for measuring marine primary productivity using the black and white bottle method, including a cultivation unit, The temperature and water flow simulation control unit, the light simulation control unit, the temperature simulation control unit uses a circular transparent water bath cover to provide a fully enclosed culture environment for the culture bottle, and drives the constant temperature water flowing continuously from the outside of the culture bottle through the circulating water bath equipment; Moreover, the temperature control range of the water bath is between 0°C and 100°C, covering the temperature that almost all marine phytoplankton can survive; this patent can not only accurately simulate the water temperature of the water sample at the original depth of the ocean, but is also applicable to any ocean in the world waters, but only at the theoretical level, and there is a large gap between the actual primary productivity data of the ocean, especially for the primary productivity of the ocean discharged from urban sewage into the sea. Due to the variable elements in the sewage discharged into the ocean, the primary Productivity changes in real time

Method used


Image

  • A Visualization Method of Ocean Primary Productivity Distribution Based on RS
  • A Visualization Method of Ocean Primary Productivity Distribution Based on RS
  • A Visualization Method of Ocean Primary Productivity Distribution Based on RS

Examples


Embodiment Construction

[0027] In order to make the technical means, creative features, goals and effects achieved by the present invention easy to understand, the present invention will be further described below in conjunction with specific embodiments.

[0028] like Figure 1 to Figure 5 As shown, a kind of RS-based marine primary productivity distribution visualization method of the present invention comprises the following steps:

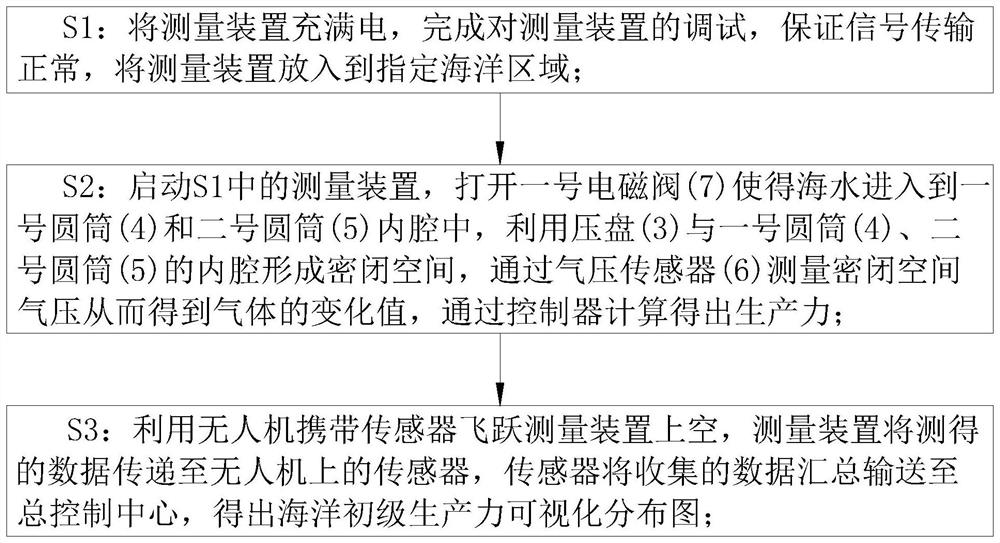
[0029] S1: Fully charge the measuring device, complete the debugging of the measuring device, ensure that the signal transmission is normal, and put the measuring device into the designated ocean area; the measuring device cannot be directly charged when measuring at sea, and ensure that the power is sufficient for the long-term use of the measuring device. Continuous work for a long time, also reduces the number of maintenance;

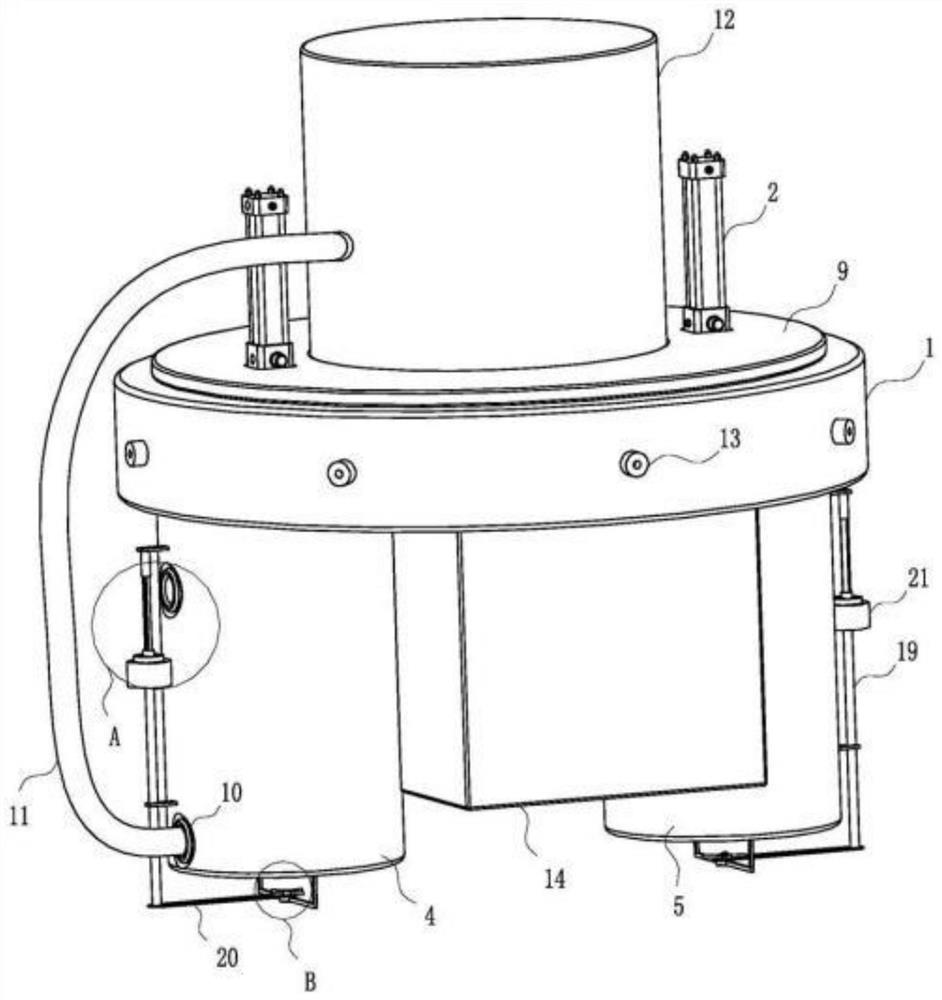
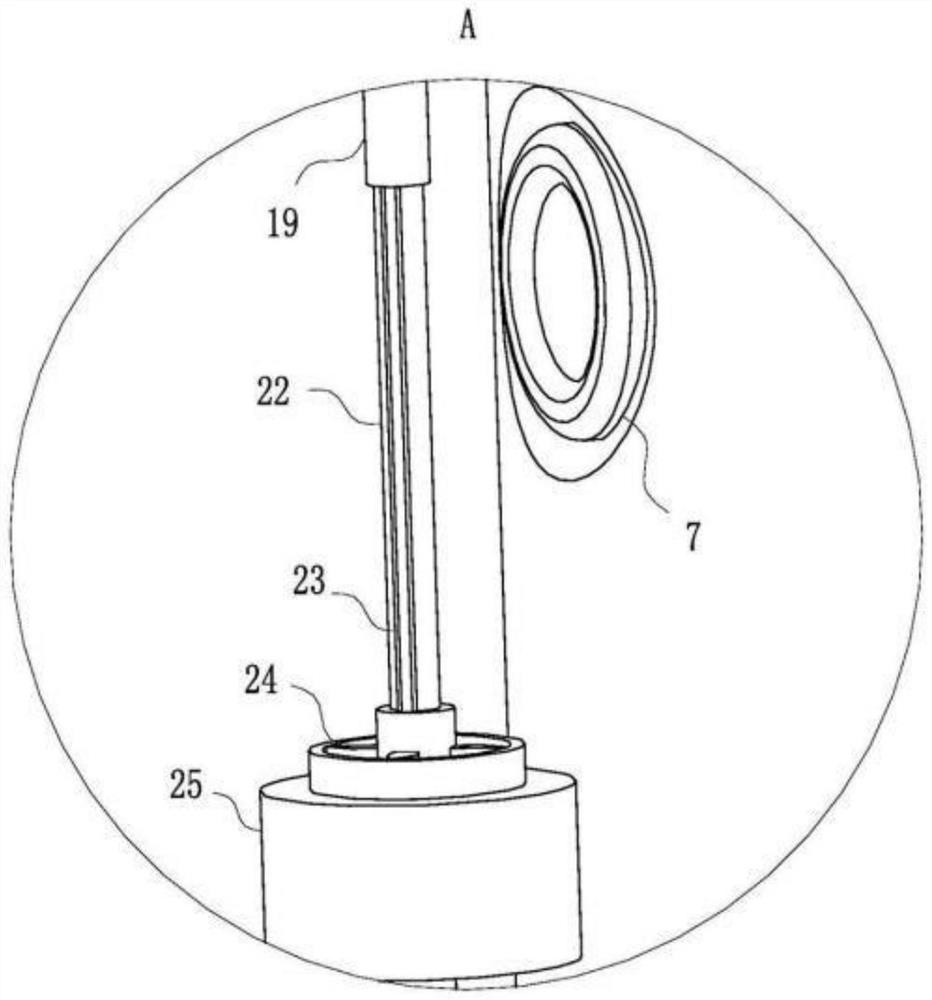
[0030] S2: Start the measuring device in S1, open the No. 1 solenoid valve 7 so that the seawater enters the inner cavity of the No. 1 cyl...


PUM


Abstract

The invention belongs to the technical field of marine primary productivity measurement, and specifically relates to a method for visualizing the distribution of marine primary productivity based on RS. The measuring device used in the method includes a housing, and two push rod motors are arranged on the top of the housing. The output shaft end of the push rod motor is fixed with a pressure plate, and the bottom of the housing is fixed with a No. 1 cylinder and a No. 2 cylinder. The No. 1 cylinder is made of transparent material, and the No. 2 cylinder is Made of non-transparent material, the bottom ends of the No. 1 cylinder and the No. 2 cylinder are closed structures, and the pressure plate is located in the inner cavity of the No. 1 cylinder and the No. The cylinder and the No. 2 cylinder are clearance fit, and the inner wall of the No. 1 cylinder and the No. 2 cylinder is provided with an air pressure sensor; the present invention monitors the marine environment in real time by using a measuring device, and realizes automation, which not only ensures The accuracy of the measurement is improved, and the labor cost is also reduced, making the measurement of marine primary productivity convenient and quick.

Description

technical field [0001] The invention belongs to the technical field of marine primary productivity measurement, in particular to a method for visualizing distribution of marine primary productivity based on RS. Background technique [0002] RS is the English abbreviation of remote sensing, which refers to the method of obtaining the state information of the target object by indirect means. Remote sensing generally has three elements, target, sensor, and measurement method. Simply put, seeing the colorful world with your eyes is a remote sensing process. Here, flowers, plants and trees are the targets, your eyes are the sensors, different colors such as red, green and blue will stimulate the retina differently, and the biophysical principles hidden behind this are the measurement methods. [0003] Ocean primary productivity refers to the ability of producers such as phytoplankton, benthic plants, and autotrophic bacteria to produce organic matter through photosynthesis, als...

Claims


Application Information

Patent Timeline
Patent Type & Authority Patents(China)
IPC IPC(8): G01N33/00B63B35/00H02J7/35
CPCB63B35/00G01N33/00H02J7/35
Inventor 余景陈丕茂吴洽儿冯雪佟飞
Owner SOUTH CHINA SEA FISHERIES RES INST CHINESE ACAD OF FISHERY SCI
Why Eureka
Try Eureka