
Novel display method of ECG waveform graph bar

A technology of electrocardiogram and chart, applied in medical image, medical science, medical report, etc., can solve problems such as limited paper standard recording speed and printing speed, and achieve the effect of reliable diagnosis

Inactive Publication Date: 2020-09-22
SHENZHEN STARCARE INNOVATIONS CO LTD +1
View PDF3 Cites 0 Cited by
  • Summary
  • Abstract
  • Description
  • Claims
  • Application Information

AI Technical Summary

Problems solved by technology

Limited by the width of the paper and the standard recording speed (or printing speed), the current bar waveform length is limited to a few seconds

Method used


Image

  • Novel display method of ECG waveform graph bar
  • Novel display method of ECG waveform graph bar
  • Novel display method of ECG waveform graph bar

Examples


Embodiment Construction

[0017] Below, in conjunction with accompanying drawing and specific embodiment, the invention is further described:

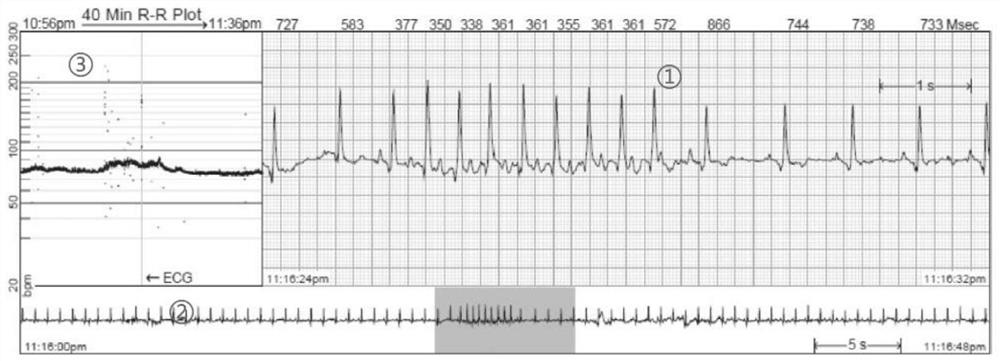
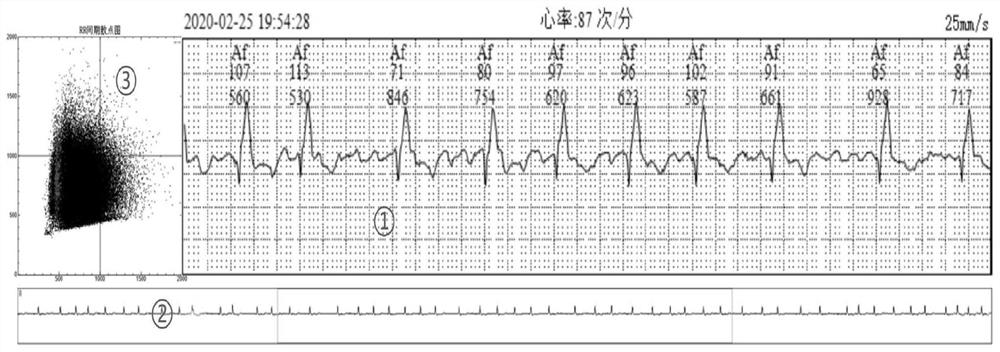
[0018] see Figure 1-3 , according to a display method of a new type of ECG waveform bar in an embodiment of the present invention, on the basis of the traditional ECG waveform bar, two new elements are added, which are respectively new element one and new element two, and the new element one is The waveform compression diagram before and after the main display waveform, the new element two is the RR interval trend diagram (or RR interval scatter diagram), thus forming a new type of ECG waveform display bar, the waveform compression diagram in the new element one There is equal ratio compression in the display of time and amplitude at the same time, that is, on the basis of ensuring that the waveform is not deformed, the waveform of the target arrhythmia event is displayed for ten seconds before and after. The time is the horizontal coordinate, and the amplitud...


PUM


Abstract

The invention discloses a novel display method of an ECG waveform graph bar. On the basis of a traditional ECG waveform graph bar, a waveform compression graph before and after a main display waveform, and a RR interval trend graph (or a RR interval scatter diagram) are added, and thereby a novel ECG waveform display graph bar is formed. The waveform compression graph is simultaneously proportionally compressed in the display of time and amplitude, that is, on the basis of ensuring that a waveform is not deformed, a waveform before and after ten seconds of a target arrhythmia event is displayed, the time is the horizontal coordinate, and the amplitude is the vertical coordinate. The RR interval trend graph is a t-RR trend graph, the abscissa of the t-RR trend graph is the time, and the ordinate is the RR interval. In the RR interval scatter diagram, the abscissa x-axis is the current RR interval, called RR (t), and the ordinate y-axis is the immediately following RR interval, called RR(t+1). The novel display method can realize the largest display of the ECG waveform before and after the ECG target event and the change of the RR interval of a patient in a limited space, and helpsclinicians to make more reliable diagnosis.

Description

technical field [0001] The present invention relates to the technical field of electrocardiogram waveforms, and relates to a display method of a new type of electrocardiogram waveform bar, specifically a method to help improve the accuracy of clinical diagnosis by providing waveforms and heart rate changes before and after potential abnormal electrocardiogram waveforms and reliability methods. Background technique [0002] Existing clinical ECG signal display technologies are mainly display or print report graph strips of electrocardiographs, ECG monitor display or print graph strips, and dynamic ECG analysis report graph strips. The length of ECG waveform reflected by the graph bar of the ECG machine is only 10 seconds, and the graph bar display in the dynamic ECG analysis report is only 5 seconds to tens of seconds. [0003] Take the dynamic electrocardiogram as an example. The dynamic electrocardiogram is the whole process of recording the cardiac electrical activity of...

Claims


Application Information

Patent Timeline
Patent Type & Authority Applications(China)
IPC IPC(8): A61B5/0402A61B5/044G16H15/00G16H30/20
CPCA61B5/72G16H30/20G16H15/00
Inventor 周韬罗申
Owner SHENZHEN STARCARE INNOVATIONS CO LTD
Learn More