Data processing method and device for visual display

A technology of data processing and processing methods, applied in special data processing applications, other database browsing/visualization, other database retrieval, etc., can solve problems such as incomplete data display, and achieve the effect of complete display, accurate data, and beautiful experience

Pending Publication Date: 2020-05-15
BANK OF CHINA
View PDF3 Cites 2 Cited by
  • Summary
  • Abstract
  • Description
  • Claims
  • Application Information

AI Technical Summary

Problems solved by technology

[0005] An embodiment of the present application provides a data processing method for visual display to solve abnormal display problems such as incomplete data display that occur during the process of visual display of data. The method includes:
[0007] The embodiment of the present application also provides a processing device for visually displaying data to solve abnormal display problems such as incomplete data display during the process of visually displaying data. The device includes:

Method used


Image

  • Data processing method and device for visual display
  • Data processing method and device for visual display
  • Data processing method and device for visual display

Examples


Embodiment Construction

[0013] In order to make the purpose, technical solutions, and advantages of the embodiments of the present application clearer, the embodiments of the present application will be further described in detail below in conjunction with the accompanying drawings. Here, the exemplary embodiments of the application and their descriptions are used to explain the application, but not to limit the application.

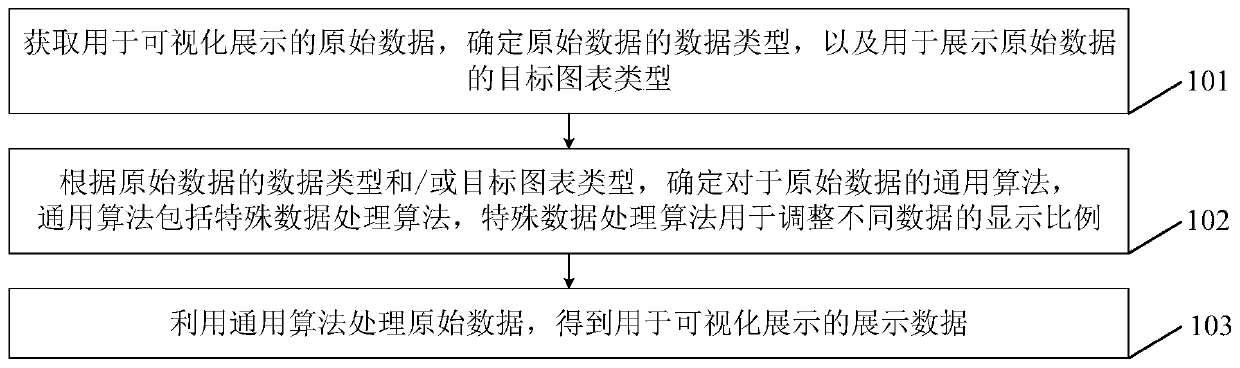
[0014] The embodiment of the present application provides a data processing method for visual display, such as figure 1 As shown, the method includes steps 101 to 103:

[0015] Step 101. Obtain raw data for visual display, determine the data type of the raw data, and the target chart type for displaying the raw data.

[0016] The data types of raw data include continuous type, discrete type, time and date type, etc.

[0017] Chart types include column charts, line charts, pie charts, bar charts, data maps, radar charts, funnel charts, area charts, gauge charts, and more. Use...


PUM


Abstract

The invention discloses a data processing method and device for visual display. The method comprises the steps of obtaining original data for visual display, and determining a data type of the original data and a target chart type for displaying the original data; according to the data type of the original data and / or the target chart type, determining a general algorithm for the original data, the general algorithm comprising a special data processing algorithm, and the special data processing algorithm being used for adjusting the display scale of different data; and processing the originaldata by using a universal algorithm to obtain display data for visual display. According to the method, the abnormal display problems of incomplete data display and the like in the process of visuallydisplaying the data can be solved.

Description

technical field [0001] The present application relates to the technical field of data processing and display, in particular to a data processing method and device for visual display. Background technique [0002] This section is intended to provide a background or context to embodiments of the invention that are recited in the claims. The descriptions herein are not admitted to be prior art by inclusion in this section. [0003] Data visualization is a way to visually display massive data. It can be used to see the trend of data changes from multiple dimensions or understand the meaning behind the data from a general level. There are currently many data visualization tools, such as echarts, etc. These data visualization tools can automatically visualize the data when they get the data. [0004] The visualization tools that directly visualize the data also have certain defects, especially for some data sets with large differences. Some data items may be too small because th...

Claims


Application Information

Patent Timeline
Patent Type & Authority Applications(China)
IPC IPC(8): G06F16/904
CPCG06F16/904
Inventor 胡国庆顾颖颖钱倩谢琳戴春春
Owner BANK OF CHINA
Why Eureka
Try Eureka