
Chart color drawing method and device, readable storage medium and electronic equipment

A chart and color technology, applied in the field of data visualization, can solve problems such as inconvenient use, inconsistent color display, and user misleading

Pending Publication Date: 2020-02-21
NEUSOFT CORP
View PDF3 Cites 0 Cited by
  • Summary
  • Abstract
  • Description
  • Claims
  • Application Information

AI Technical Summary

Problems solved by technology

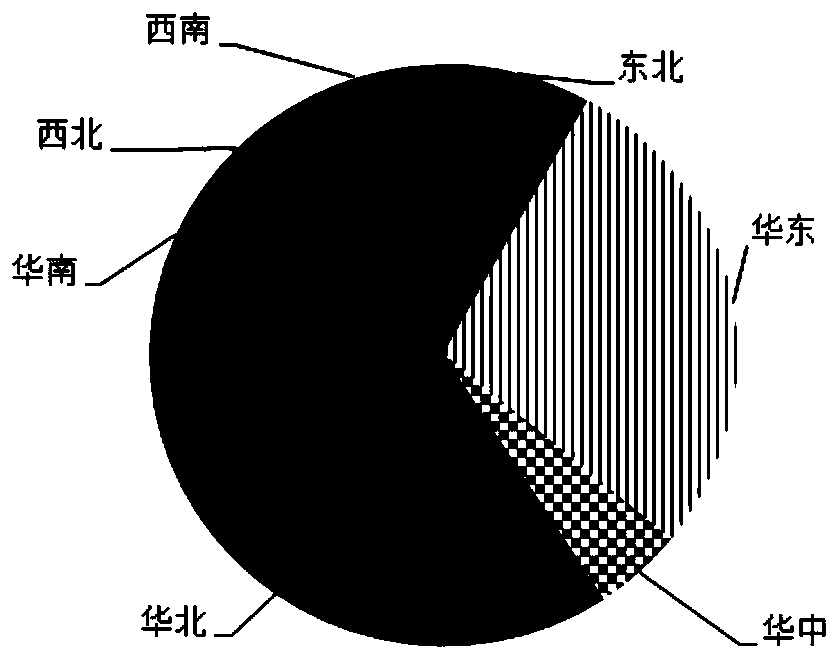
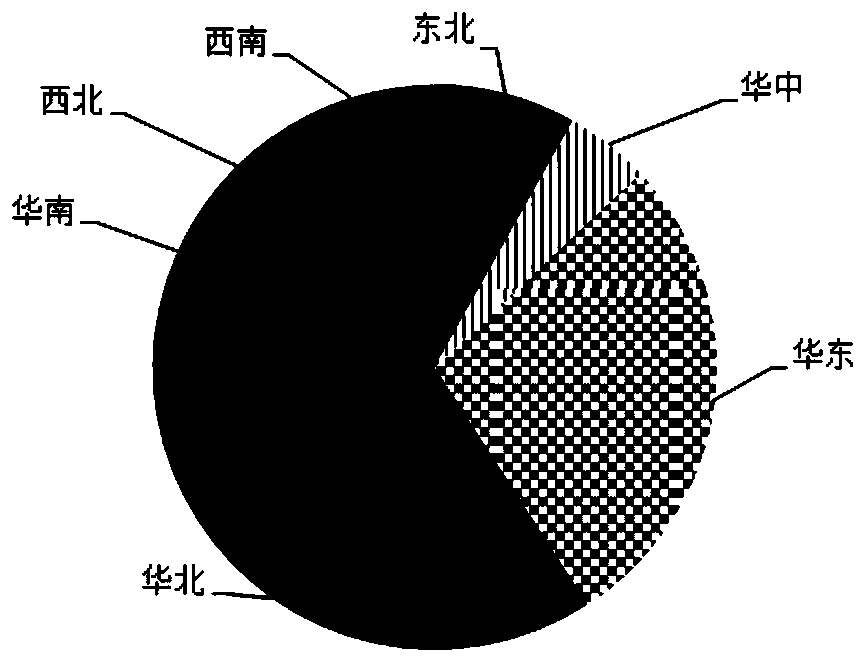
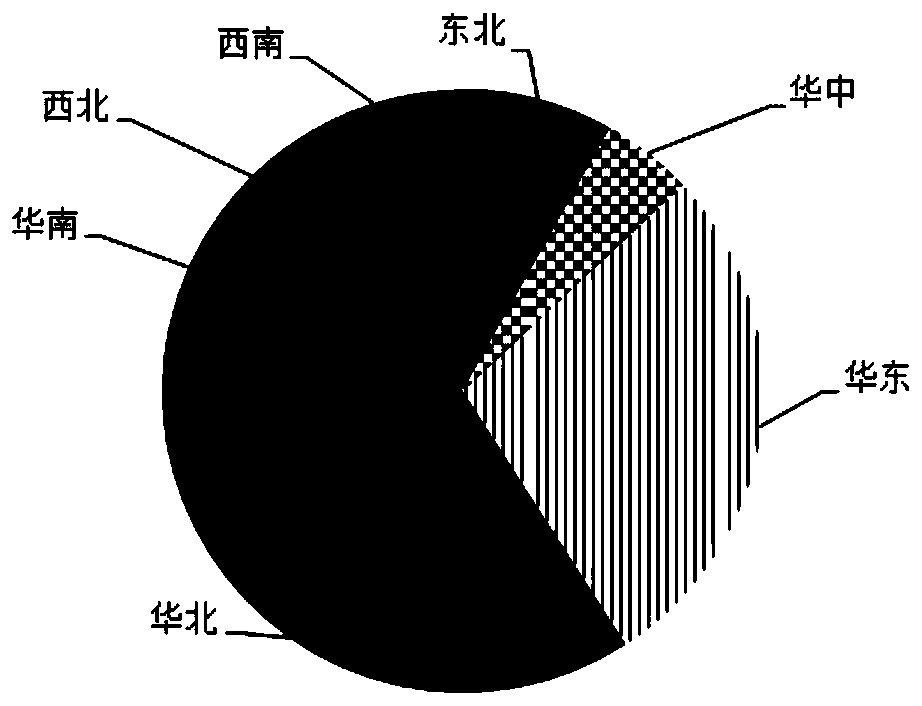
In the prior art, when drawing charts based on data, the displayed colors are usually assigned according to the order of the attributes of the fields. Therefore, when drawing charts for the same data table, the number of field attributes or the order of attributes may change. The color display of the same attribute is inconsistent in the chart
When drawing charts of d

Method used


Image

  • Chart color drawing method and device, readable storage medium and electronic equipment
  • Chart color drawing method and device, readable storage medium and electronic equipment
  • Chart color drawing method and device, readable storage medium and electronic equipment

Examples


Embodiment Construction

[0049] Specific embodiments of the present disclosure will be described in detail below in conjunction with the accompanying drawings. It should be understood that the specific embodiments described here are only used to illustrate and explain the present disclosure, and are not intended to limit the present disclosure.

[0050] In order to make it easier for those skilled in the art to understand the technical solutions provided by the embodiments of the present invention, the related technologies and application scenarios involved are briefly introduced below.

[0051]As described in the background art, in order to facilitate the user to analyze data intuitively, the data table may be displayed in the form of a chart. Each chart has its corresponding chart type, which indicates the shape displayed by the chart, for example, a chart type can be a bar chart, a line chart, a pie chart, and so on. There are fields displayed in the chart, and the attribute of the field refers to...


PUM


Abstract

The invention relates to a chart color drawing method and a device, a readable storage medium and an electronic device. The method comprises the steps of obtaining a first chart color type of a to-be-drawn target chart; obtaining a first chart color type according to the first chart color type, determining whether a target color model matched with the target chart exists in pre-generated color models, wherein the target color model is used for indicating the color of at least one data item corresponding to an effective field in the target chart, the effective field is a field to be subjected to color display in the target chart, and the data item comprises the attribute of the at least one effective field; and if it is determined that the target color model exists, drawing the target chartaccording to the target color model. Therefore, when the target chart is drawn, drawing can be carried out according to the target color model matched with the target chart, the consistency of colordisplay of the attributes corresponding to the effective fields in the target chart can be effectively guaranteed, the use requirements of a user are met, and the use experience of the user is improved.

Description

technical field [0001] The present disclosure relates to the field of data visualization, in particular, to a chart color drawing method, device, readable storage medium and electronic equipment. Background technique [0002] In the field of data visualization, charts are generally drawn based on fields, so as to provide users with visual data display. In the prior art, when drawing charts based on data, the displayed colors are usually assigned according to the order of the attributes of the fields. Therefore, when drawing charts for the same data table, the number of field attributes or the order of attributes may change. The same attribute is displayed in inconsistent colors in the chart. When drawing charts of different chart types, due to the different angles of data analysis, for example, using a column chart to view the comparison of data size, using a pie chart to view the percentage of data, etc., the same attribute appears in different types of charts The corresp...

Claims


Application Information

Patent Timeline
IPC IPC(8): G06F9/451
CPCG06F9/451
Inventor 朱俊海
Owner NEUSOFT CORP
Learn More