
PM2. 5 inversion method and monitoring region segmentation method

A monitoring area and inversion technology, applied in measurement devices, particle suspension analysis, suspension and porous material analysis, etc., can solve the problems of low AOD inversion accuracy, increase satellite AOD missing rate, etc., and achieve seamless high-precision calculation , reduce interference and ensure stability

Active Publication Date: 2019-06-07
天津珞雍空间信息研究院有限公司
View PDF5 Cites 7 Cited by
  • Summary
  • Abstract
  • Description
  • Claims
  • Application Information

AI Technical Summary

Problems solved by technology

In addition, the inversion of AOD is related to the albedo of the surface. When the albedo of the surface is high, the surface is highlighted. The inversion accuracy of AOD is low, and the missing rate of satellite AOD will be increased when the quality control and screening of data are carried out.

Method used


Image

  • PM2. 5 inversion method and monitoring region segmentation method
  • PM2. 5 inversion method and monitoring region segmentation method
  • PM2. 5 inversion method and monitoring region segmentation method

Examples


Embodiment 2

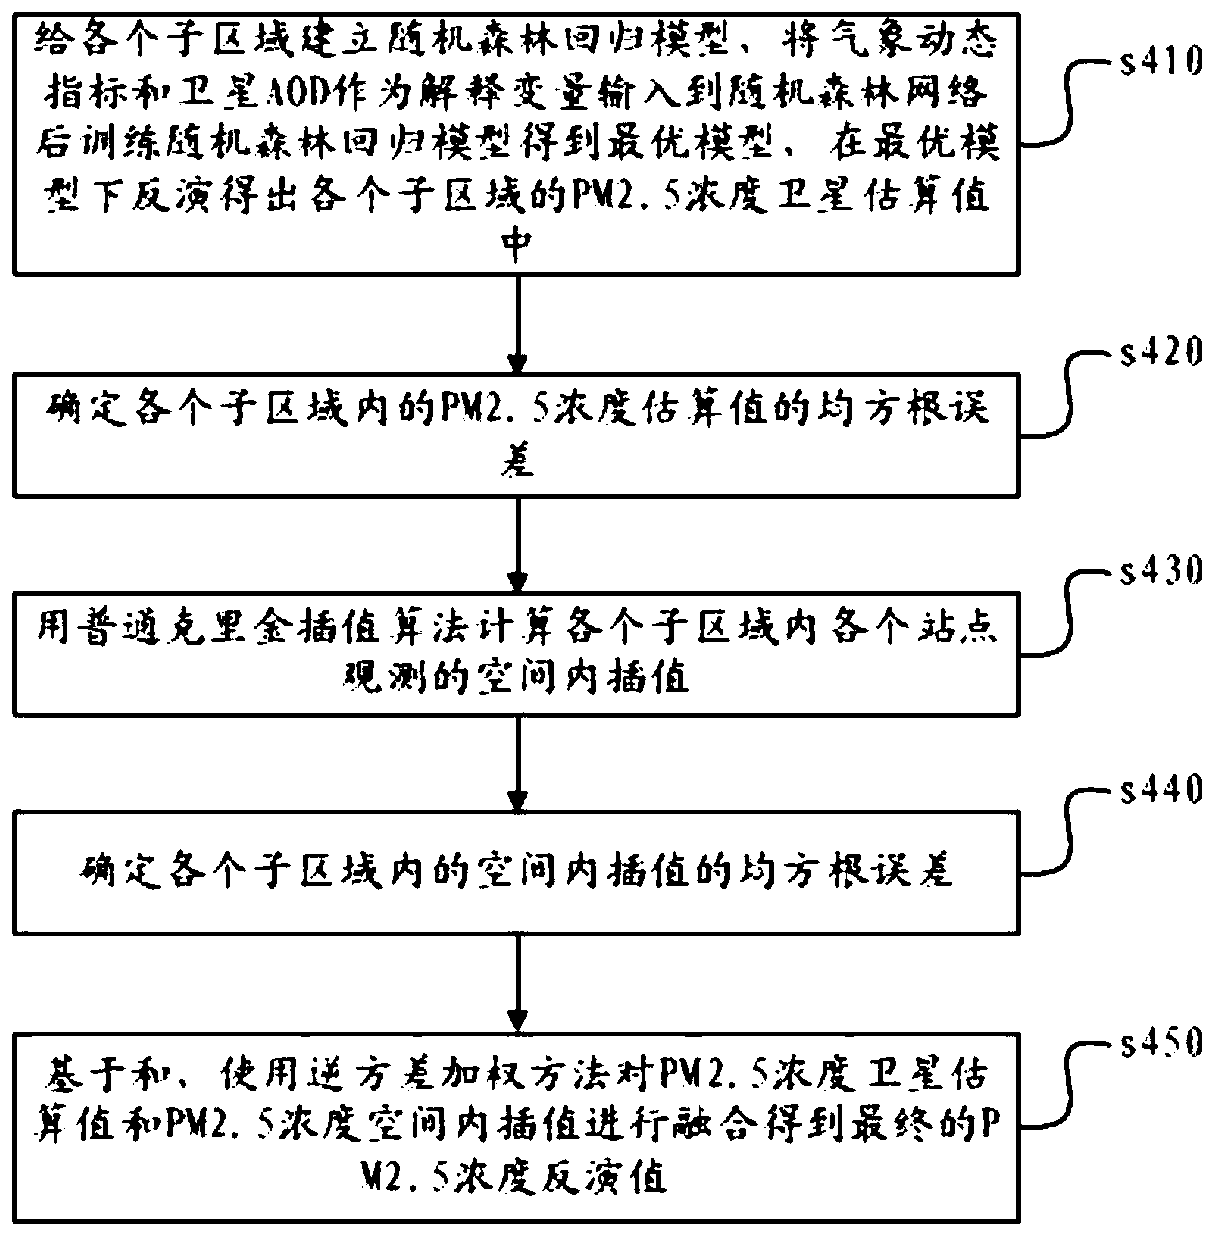
[0072] The PM2.5 inversion method that embodiment two provides, on the basis of the monitoring area segmentation method of embodiment one, the monitoring area is divided into several sub-areas, and then carry out PM2.5 inversion according to the following steps:

[0073] s410. Establish a random forest regression model for each sub-region, input the meteorological dynamic index and satellite AOD as explanatory variables into the random forest network, train the random forest regression model to obtain the optimal model, and invert each sub-region under the optimal model Satellite estimates of PM2.5 concentrations for In , the meteorological dynamic indicators may be, for example, surface temperature, surface pressure, wind speed, relative humidity, and boundary layer height.

[0074] AOD is the aerosol optical depth, which is the integral of the aerosol extinction coefficient in the vertical direction. It is a physical quantity that quantitatively describes the reduction effe...

Embodiment 3

[0085] On the basis of Embodiment 2, the following steps are also included before step 440. Before the above-mentioned step s460, the following steps are also included:

[0086] s460. Establish satellite estimates of PM2.5 concentrations and spatial interpolation The fitting function of .

[0087] According to the fitting function, the corresponding station data of the PM2.5 concentration estimation value of the missing corresponding ground station data are obtained.

[0088] Satellite observations have missing data, while spatial interpolation Due to the sparse and uneven distribution of stations, the interpolation accuracy also varies in space. Combining the results of the two can not only reduce the error to a certain extent, but also increase the spatial coverage of the inversion results. The specific execution process is divided into two steps. Firstly, the fitting function between the two is established, and there is a spatial interpolation function for no satellit...


PUM


Abstract

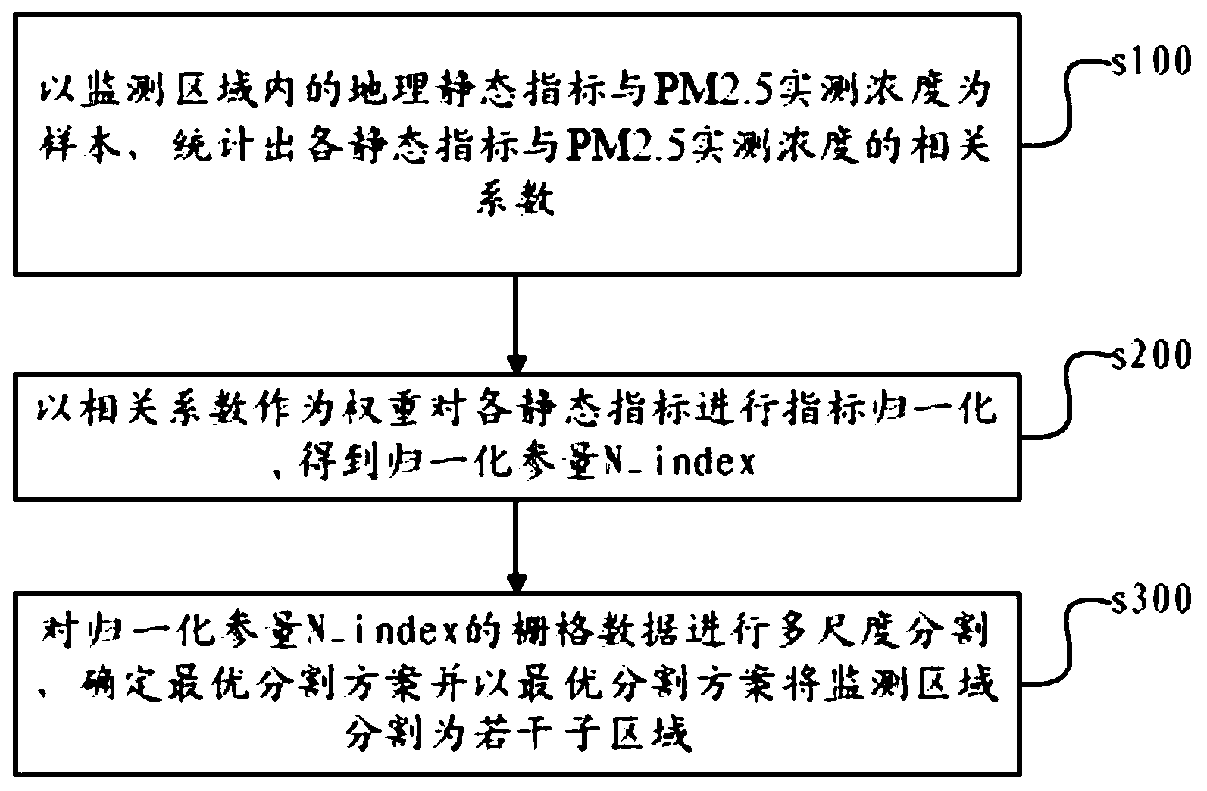
The invention discloses a monitoring region segmentation method for PM2. 5 inversion and a PM2. 5 inversion method. The monitoring region segmentation method comprises the following steps: with geographic static indexes and PM2. 5 measured concentration in a monitoring region being as samples, summarizing a correlation coefficient of each static index and the PM2. 5 measured concentration; with the correlation coefficient being as weight, carrying out index normalization on each static index to obtain a normalized parameter N_index, wherein the normalized parameter N_index is displayed in theform of raster data; and carrying out multi-scale segmentation on the raster data of the normalized parameter N_index, and determining an optimal segmentation scheme and dividing the monitoring regioninto a plurality of subregions according to the optimal segmentation scheme. The monitoring region is divided through the multi-scale segmentation algorithm, thereby reducing interference of spatialheterogeneity on parameter estimation; and for each of different research subregions, a specific particle concentration inversion model is established.

Description

technical field [0001] The present disclosure generally relates to the technical field of environmental monitoring, in particular to the monitoring technology of particulate matter in the air, and in particular to a monitoring area segmentation method for PM2.5 inversion and a PM2.5 inversion method. Background technique [0002] In the past few decades, due to rapid urban expansion and industrialization, a large amount of particulate matter (PM, that is, particles with a diameter between 1 nanometer and 100 microns) has been emitted into the air, resulting in frequent occurrence of haze events, especially in economically developed countries. and densely populated metropolitan areas. [0003] Atmospheric particulate matter is the most important component of aerosols and affects weather and climate systems through direct or indirect effects. Specifically, on the one hand, aerosols can directly absorb and scatter solar radiation and disturb the energy budget of the earth-atmo...

Claims


Application Information

Patent Timeline
Patent Type & Authority Applications(China)
IPC IPC(8): G01N15/06
Inventor 宋沙磊徐宝马昕李治平莫云龙
Owner 天津珞雍空间信息研究院有限公司
Learn More