
Detecting method for wheat grain hardness

A detection method and technology for wheat grains, which are applied in measurement devices, preparation of test samples, and color/spectral property measurement, etc. The effect of rapid screening and detection of large-scale breeding offspring, low equipment purchase cost, and shortened time

Active Publication Date: 2018-10-30
INST OF CEREAL & OIL CROPS HEBEI ACAD OF AGRI & FORESTRY SCI
View PDF2 Cites 2 Cited by
  • Summary
  • Abstract
  • Description
  • Claims
  • Application Information

AI Technical Summary

Problems solved by technology

The particle index method is mainly to grind the grain into flour, and after passing through a specific sieve for a certain period of time, calculate the ratio of the mass after the sieve to the mass before the sieve, which is the PSI value of the sample. The particle index method is a standard reference method and is the most widely used. However, the detection takes the longest time; near-infrared spectroscopy mainly uses two strong absorption points of near-infrared light at wavelengths of 1680 and 2230nm to establish a model for the detection of grain hardness. Although this method is fast and convenient, the purchase cost of near-infrared detection equipment is high ; The Single Kernel Grain Characteristic Analyzer was developed by the American Grain Market Research Office and the Swedish Perten Instrument Company to measure the hardness of the kernel by measuring the force required to crush it
Although the method is simple to operate and the data is reliable, the instrument also has the problem of high price and is easily blocked by impurities and large particles
At present, the latter two methods are mainly used to detect the hardness of wheat kernels, but these three methods have different shortcomings and are difficult to be widely used

Method used


Image

  • Detecting method for wheat grain hardness
  • Detecting method for wheat grain hardness
  • Detecting method for wheat grain hardness

Examples


Embodiment Construction

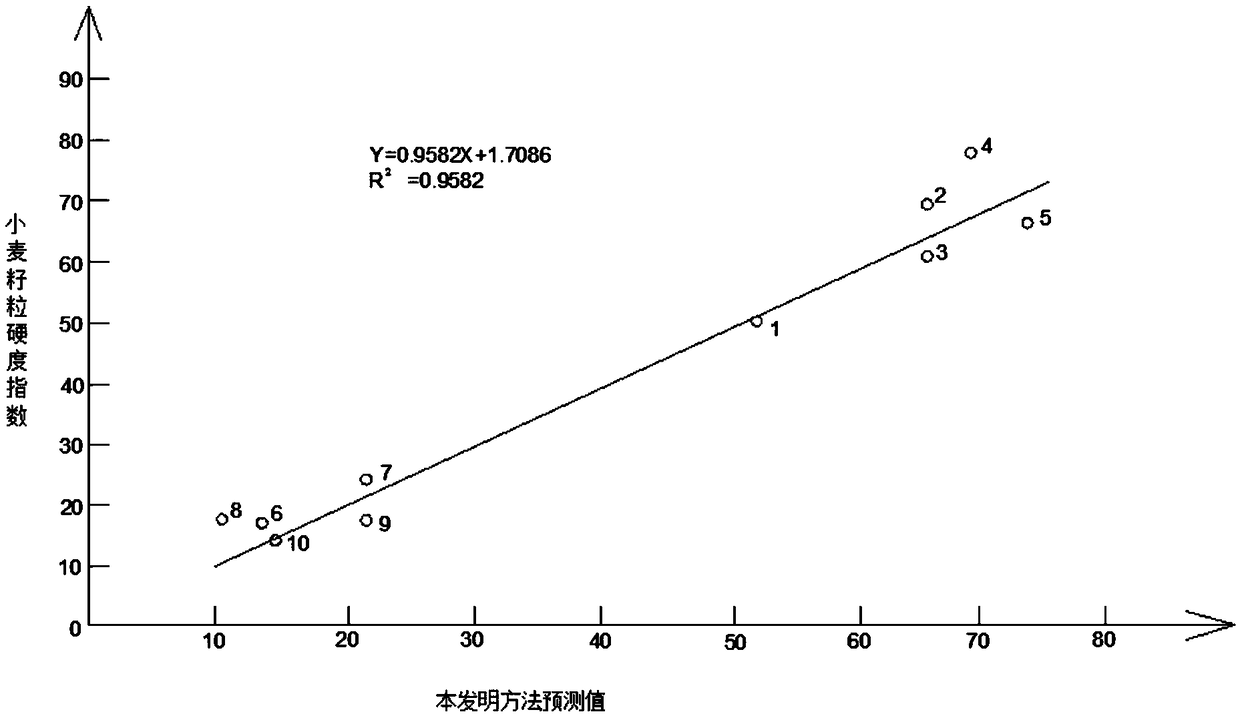
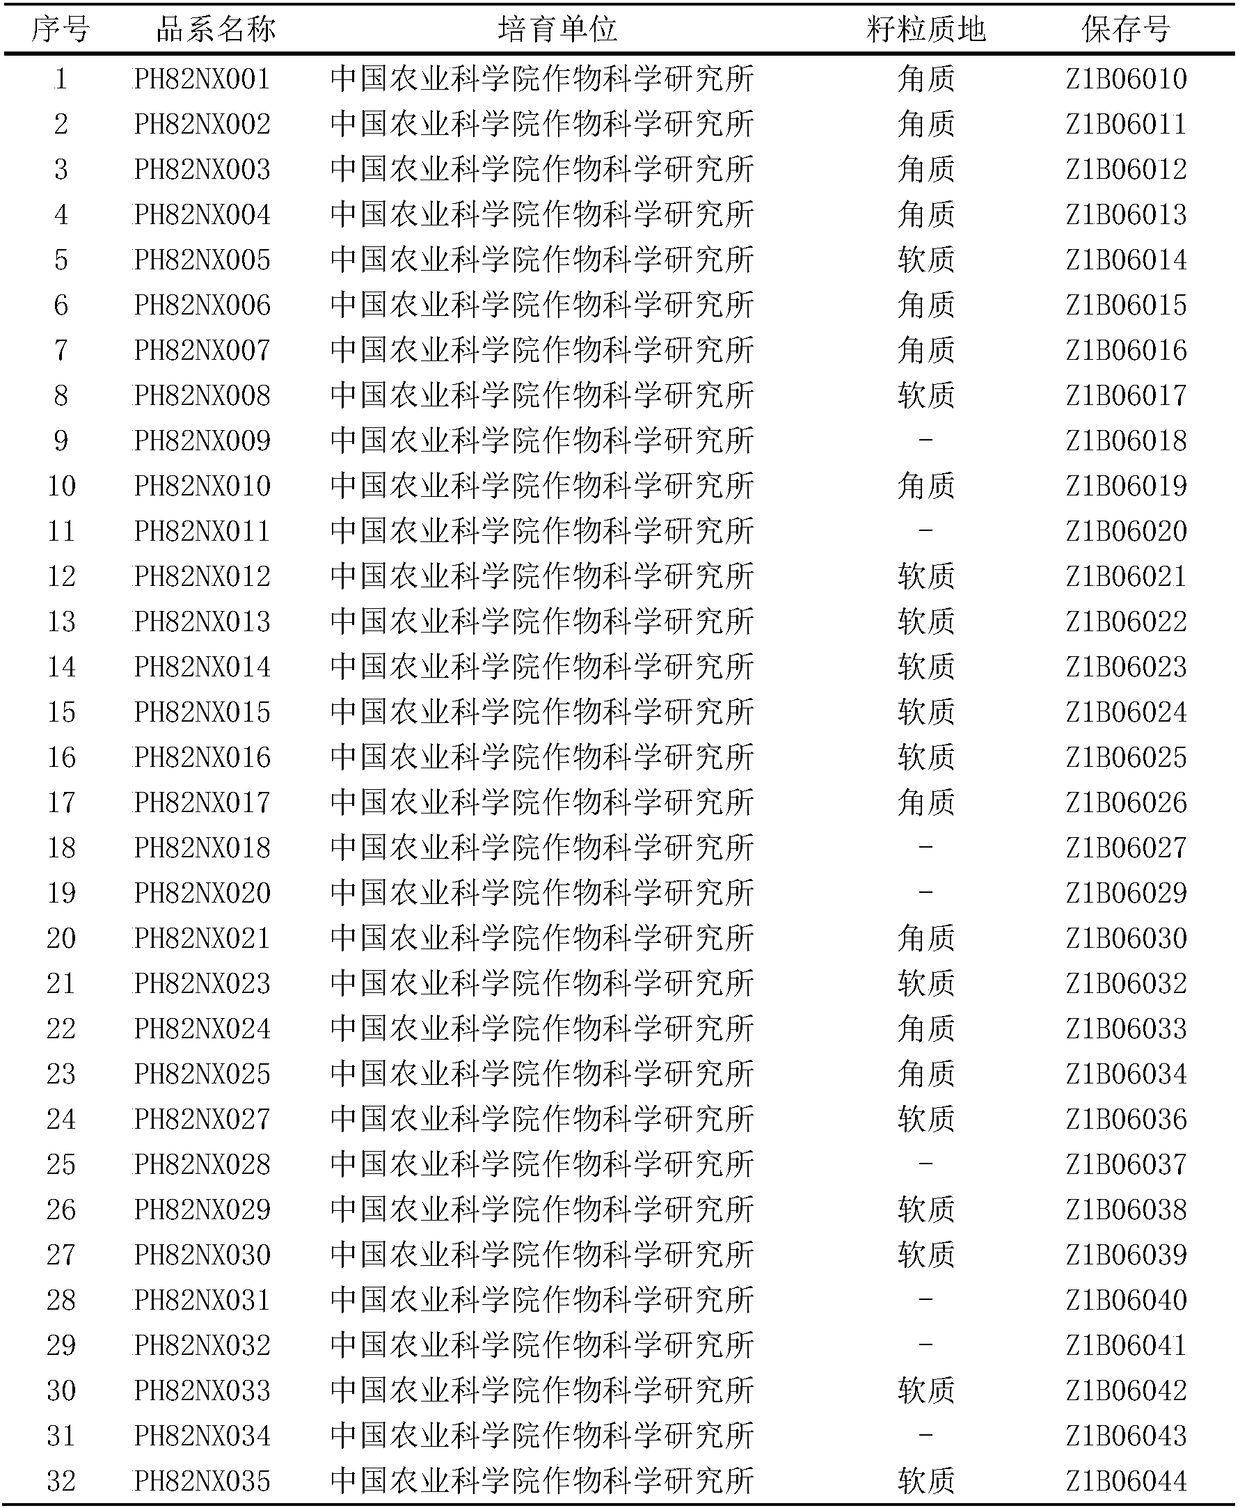
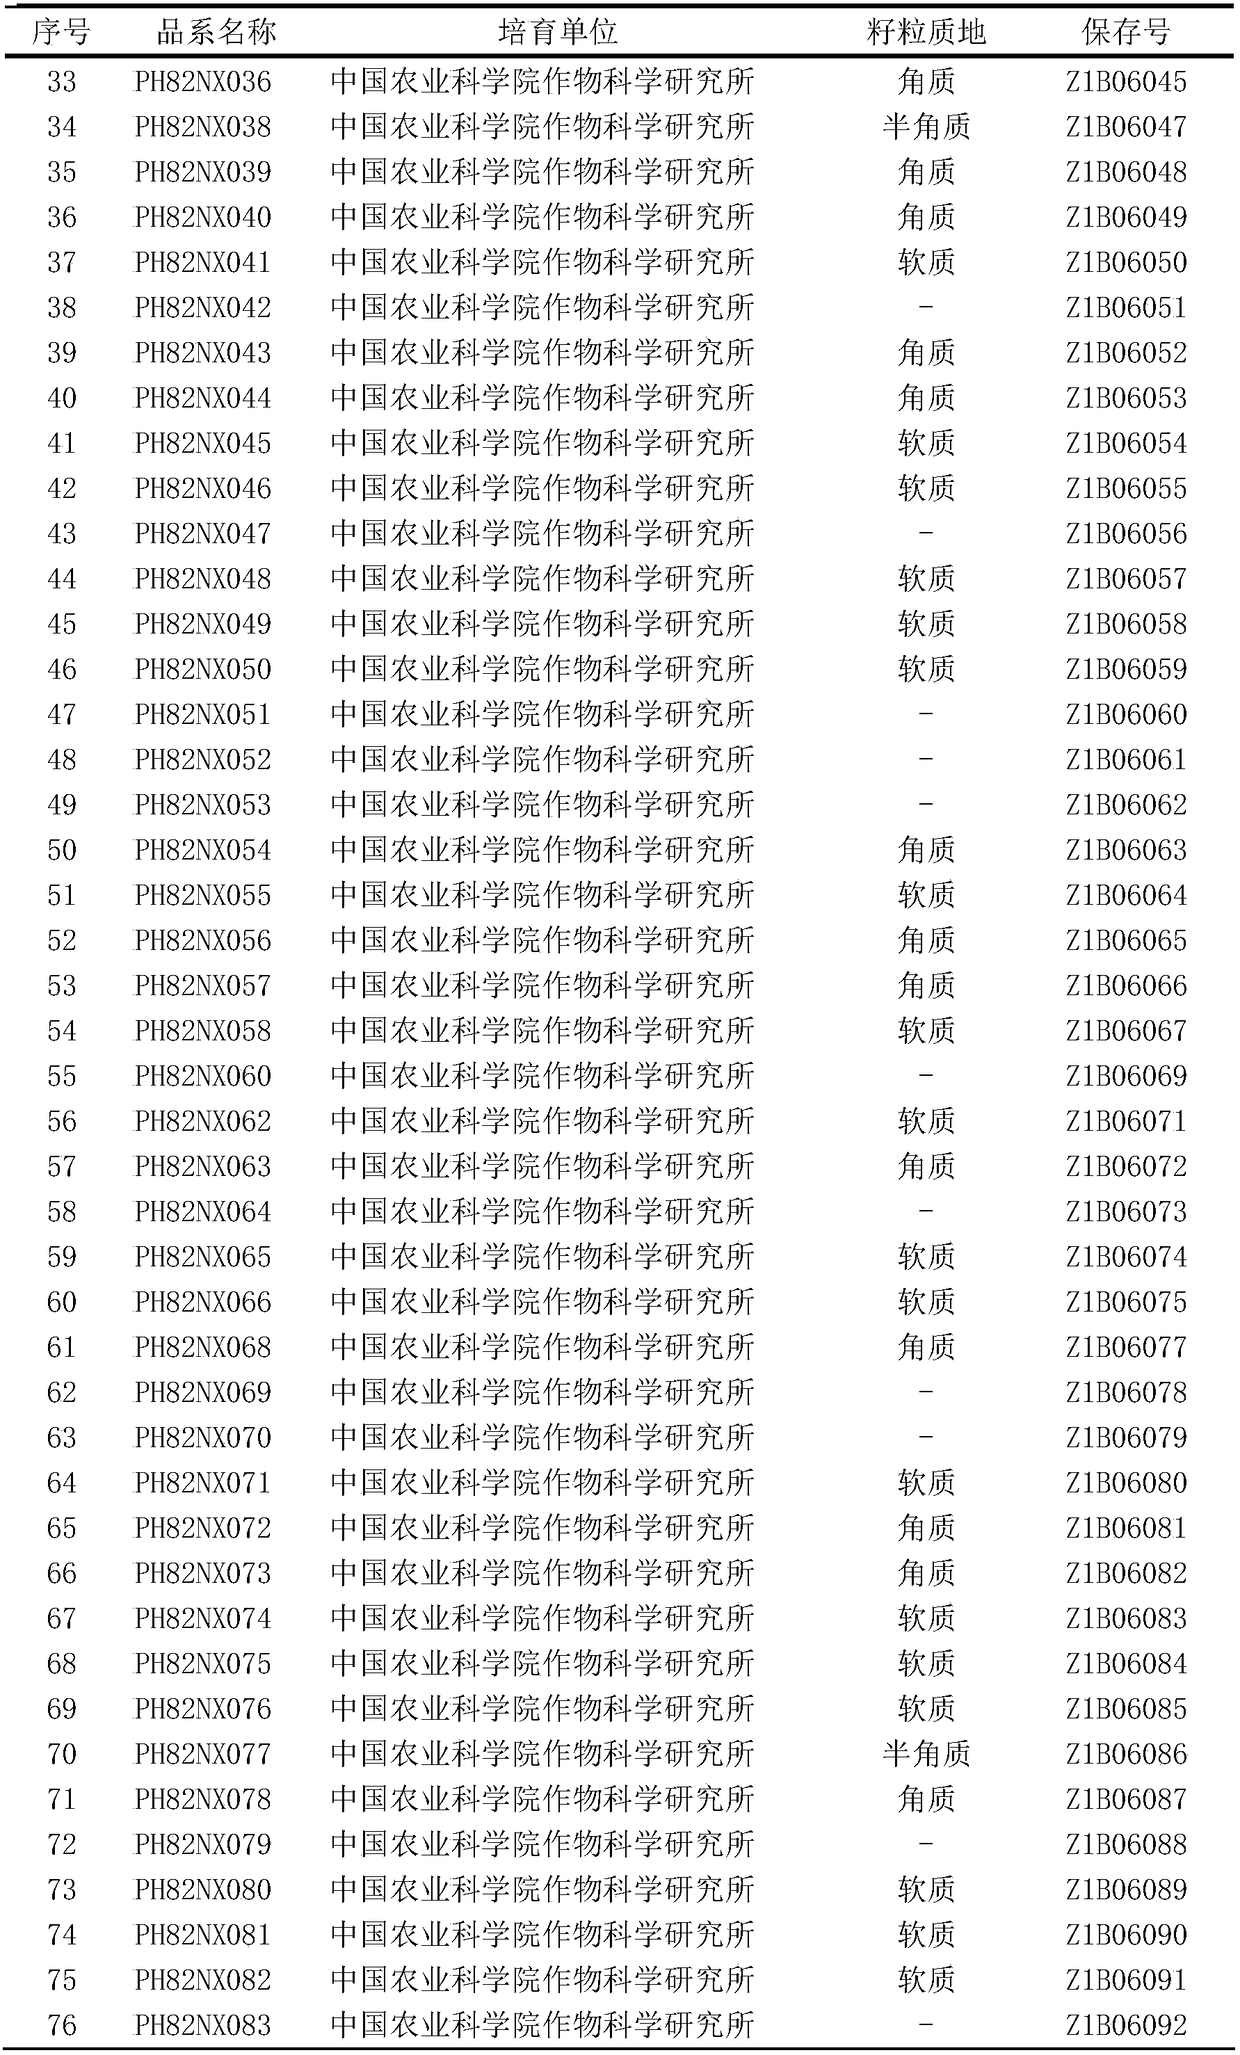
[0022] The invention relates to a method for detecting the hardness of wheat grains, which includes dampening wheat flour, collecting the color difference value of the flour emitted from a calibration set sample, detecting the grain hardness of the calibration set sample, establishing a regression calibration model, and collecting and predicting the reflection of the sample flour The light color difference value and the final hardness prediction calculation, the specific operation process is described in detail through specific examples. In the specific examples, the test materials used, unless otherwise specified, are purchased from Shanghai Shenggong Bioengineering Technology Co., Ltd. The infrared analyzer was purchased from the Danish Flowserve Analytical Instrument Company, and the Konica Minolta Color Difference Meter CR-400 was purchased from Shanghai Tuxin Electronic Technology Co., Ltd. The Junior small test mill was purchased from Beijing Guanyuan Technology Co., Ltd.,...


PUM


Abstract

The invention relates to a detecting method for a wheat grain hardness. The detecting method comprises steps of wetting wheat and powdering, collecting a flour reflected light color difference value of a calibration set sample, detecting a grain hardness of the calibration set sample, building a regression calibration model, collecting a flour reflected light color difference value of a predictionset sample and finally predicting and calculating the hardness. Through using three parameters of the color difference value as X variables, regression analysis is performed, a problem that an singleindex cannot represent two or more than two flour color influence factors simultaneously is avoided, the multi-variable regression analysis is used for screening an optimal variable combination and building the calibration model. The prediction precision of the grain hardness is high. The compositions of the calibration set sample comprise cutin wheat and powder wheat. The calibration error influence caused by the same type of the wheat hardness is avoided. The prediction set samples are more, and the rapid and convenient advantages of the detecting method are shown more. The detecting methodis suitable for the hardness prediction of the wheat grain samples on a large scale. Compared with a near-infrared detecting device, the purchase expense is low. Compared with other methods, the detection time is greatly shortened.

Description

Technical field [0001] The invention belongs to the technical field of wheat hardness detection, and specifically relates to a method for detecting wheat grain hardness. Background technique [0002] Grain hardness is an important wheat grading standard, which significantly affects the quality of wheat flour such as grain size and flour extraction rate, gluten quality such as gluten content, dough characteristics, and food processing quality such as noodles. [0003] At present, the main methods for detecting grain hardness include particle index method, near-infrared spectroscopy and single-grain cereal characterization method (SKCS). The particle index method is mainly to grind the grains into flour. After passing through a specific sieve for a certain period of time, calculate the ratio of the mass after the sieve to the mass before the sieve. However, the detection time is the longest. Near-infrared spectroscopy mainly uses the strong absorption points of near-infrared light a...

Claims


Application Information

Patent Timeline
Patent Type & Authority Applications(China)
IPC IPC(8): G01N1/28G01N21/25
CPCG01N1/28G01N21/251
Inventor 张业伦孟雅宁李杏普蔡华兰素缺吕亮杰
Owner INST OF CEREAL & OIL CROPS HEBEI ACAD OF AGRI & FORESTRY SCI
Learn More