
A human-computer interactive power grid single-line digital modeling method

A modeling method and interactive technology, applied in design optimization/simulation, special data processing applications, geometric CAD, etc., can solve the problem of not being able to modify new primitives and add new forms of grid data preservation, different, no data check, etc.

Active Publication Date: 2021-10-26
福建永福信息科技有限公司
View PDF9 Cites 0 Cited by
  • Summary
  • Abstract
  • Description
  • Claims
  • Application Information

AI Technical Summary

Problems solved by technology

[0004] 1. For the topological structure of the power grid, it is only suitable for drawing simple radial feeder systems for reliability assessment, not for analysis of mesh topological structures; new power market policies such as changes in competition management systems, separation of plants and networks, transmission and distribution Electrical separation adds new forms to the graphic elements of the power system, and the drawing form of the graphic elements, the generation method and device of the one-line diagram must be adjusted accordingly;
[0005] 2. In terms of visual drawing and human-computer interaction, the drawing function of the graphic drawing module needs to be further improved and improved;
[0006] 3. There is no data verification function, and the modification of new graphics elements and the storage of grid data in new forms cannot be realized
Although this patent also adopts the automatic conversion of AutoCAD graphics into dispatching one-line diagrams and system diagrams used by dispatchers in distribution automation systems, this method adopts the method of hierarchical conversion and hierarchical display in large and medium-sized distribution network automation systems , choose to convert and display the different information of the background layer, device layer, and device label layer, and at the same time automatically generate the topological relationship of the graph row; that is, the technical solution adopted is not the same as this patent

Method used


Image

  • A human-computer interactive power grid single-line digital modeling method
  • A human-computer interactive power grid single-line digital modeling method
  • A human-computer interactive power grid single-line digital modeling method

Examples


Embodiment Construction

[0051] The present invention will be further described below in conjunction with the accompanying drawings.

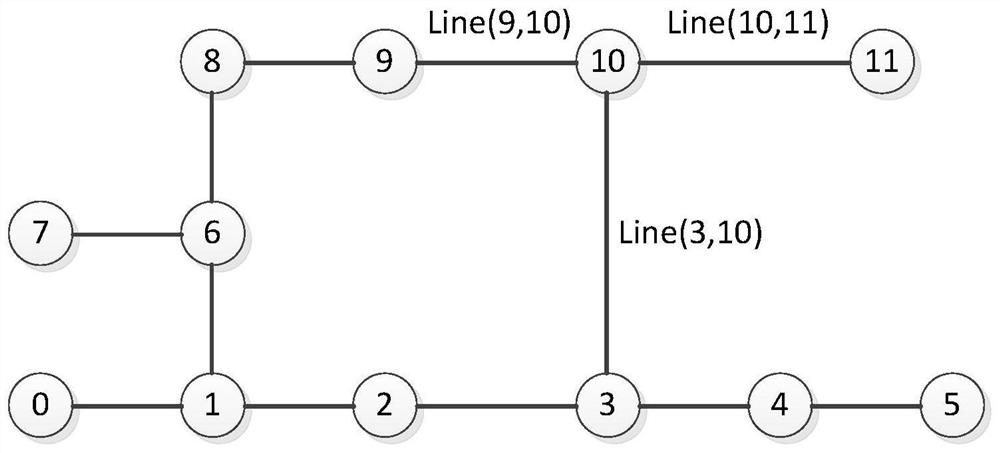
[0052] The present invention combines dwg drawings with user exchange data and information through the visualization (Graphical User Interface) technology to carry out digital modeling. Digital modeling automatically generates single-line diagrams of power grids, with features such as human-computer interaction, data verification, dynamic editing of parameterized data, and drawing data that can be saved to table data after editing. After the drawing is completed, power supply reliability can be calculated and analyzed. And it can export the one-line diagram of the distribution network stored in the drawing to generate a data table stored in Excel.

[0053] see Figure 1 to Figure 9 As shown in the present invention, a human-computer interactive power grid single-line digital modeling method, the method includes the following steps:

[0054] Step S1, analyze and prepr...


PUM


Abstract

The present invention provides a human-computer interactive power grid single-line digital modeling method, the method is: step S1, analyzing and preprocessing the power grid data; the power grid data includes pole point data, pole line data, and equipment data, And reconstruct the data structure of the pole line data of the grid data; step S2, check the continuity, repeatability and integrity of the grid data; step S3, use the graph depth-first search algorithm to check the grid data The data is digitally modeled as a one-line diagram; step S4, when the operator conducts reliability performance analysis of the grid line power supply or there is a problem with the drawing of the one-line diagram itself, the operator can edit and modify the one-line diagram; step S5, the modified grid data can be Stored again in grid data table. The invention adopts human-computer interaction to draw a grid single-line diagram, which is convenient for operators to use and also convenient for designers to analyze the reliability of grid power supply.

Description

technical field [0001] The invention relates to the field of grid power supply, in particular to the technical fields of computer graphics and electric power engineering, and in particular to a human-computer interactive grid single-line digital modeling method. Background technique [0002] Existing power grid data is stored separately in excel form data and dwg drawings without correlation. The reliability analysis of line power supply using Excel table data is not visualized, and the reliability of the analysis results is poor; the dwg drawings obtained by traditional modeling lack parametric data, and power supply reliability analysis cannot be performed. At the same time, with the development of the power system, the power system has become an increasingly complex and huge system. The application of visual graphics technology will help the research and operation management of the power system. Due to the complex structure of the distribution network structure, a large ...

Claims


Application Information

Patent Timeline
Patent Type & Authority Patents(China)
IPC IPC(8): G06F30/20
CPCG06F30/18Y02E60/00
Inventor 马杰刘泽春廖秋阳
Owner 福建永福信息科技有限公司
Learn More