Methods for predicting drug responsiveness in cancer patients
A technology for patients and cancer, applied in biochemical equipment and methods, drug combinations, pharmaceutical formulations, etc., can solve the problem of losing critical time
- Summary
- Abstract
- Description
- Claims
- Application Information
AI Technical Summary
Problems solved by technology
Method used
Image
Examples
example 1
[0292] Example 1. Identification of biomarkers of sensitivity and resistance to cisplatin using the Affiliate HG-U133A array.
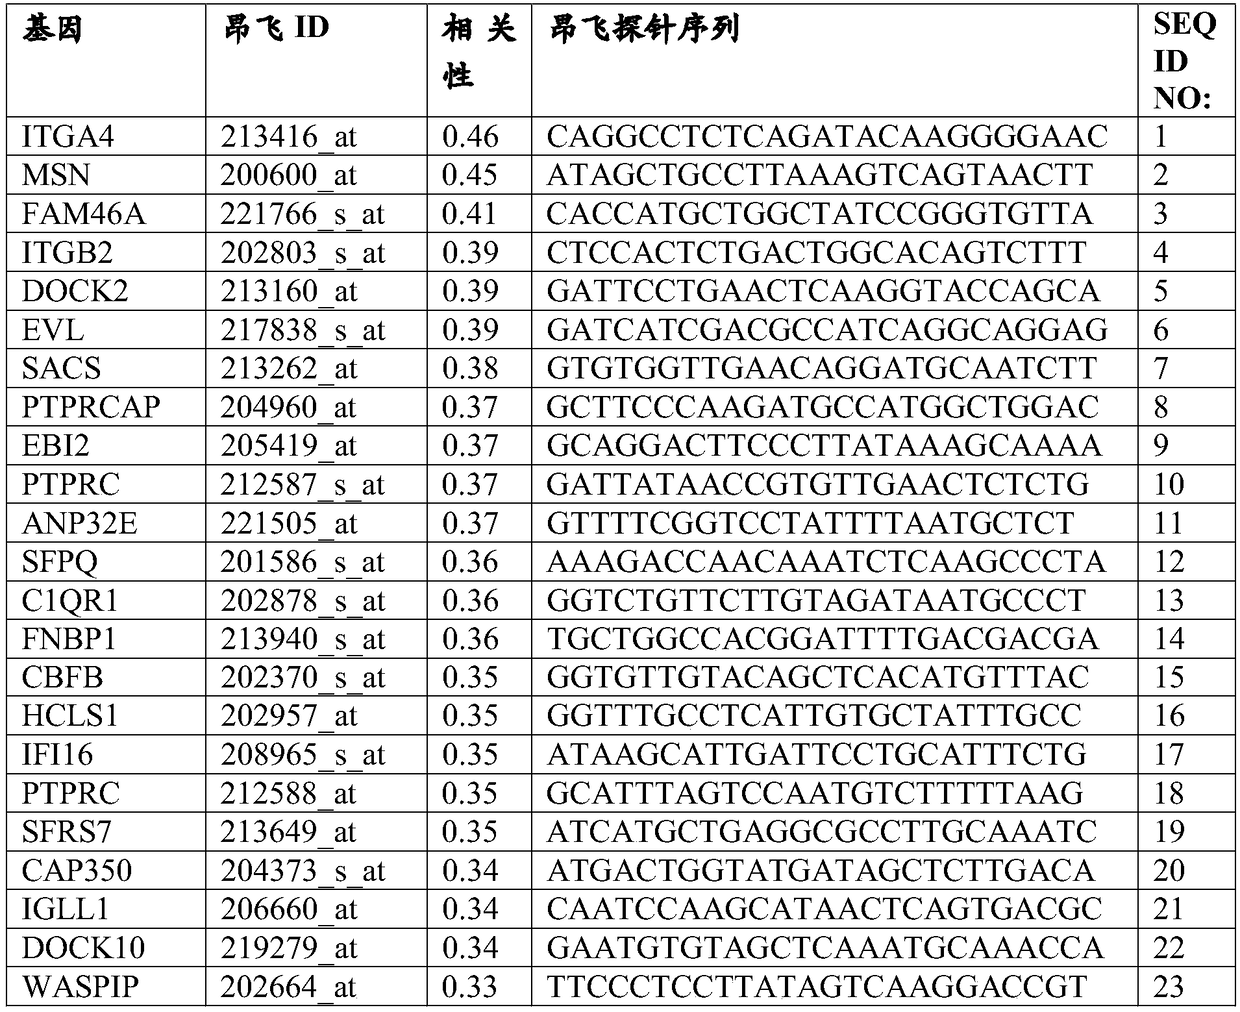
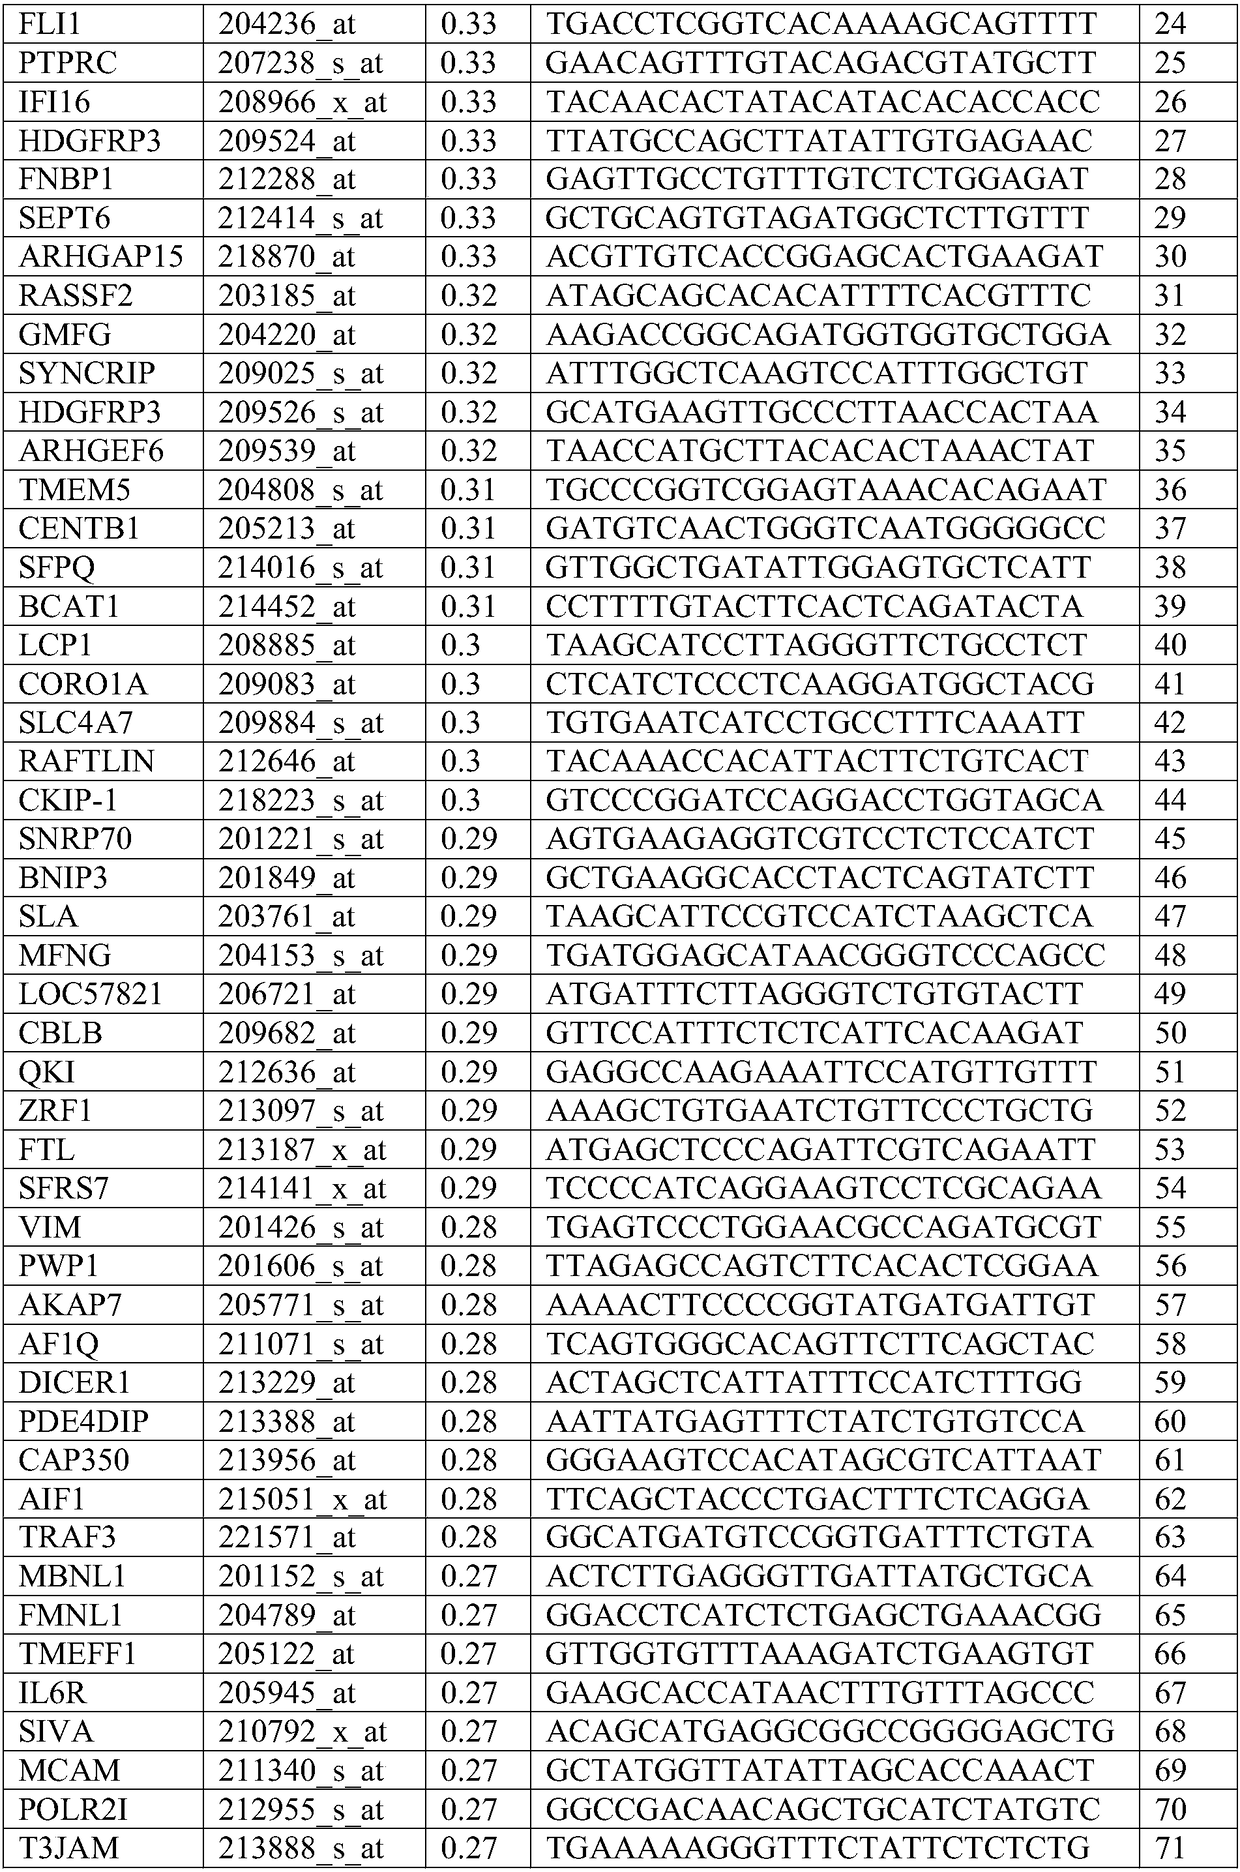
[0293] The DNA microarray measurements of 60 cancer cell lines in the NCI60 dataset were performed using the Affiliate HG-U133A array and their logit was normalized. For each array, a logit transformation was performed followed by a Z-transformation to mean zero and SD1 and correlate with growth inhibition (log(GI50)). Growth inhibition data for cisplatin against the same cell lines were downloaded from the National Cancer Institute. The expression of each gene in each cell line correlated with the growth (log(GI50)) of those cell lines in the presence of cisplatin. Those correlation coefficients were then determined to identify genes that were positively and negatively correlated with sensitivity to cisplatin. Tables 1 and 2 show the top positively correlated genes (biomarkers with sensitivity) and negatively correlated genes (biomarkers with resis...
example 2
[0294] Example 2. Identification of sPLA using the Affiliate HG-U133A array 2 Hydrolyzable, cisplatin-containing liposomes have biomarkers of sensitivity and resistance.
[0295] DNA chip measurements of 60 cancer cell lines of the NCI60 dataset were also performed using the HG-U133_Plus_2 array and their logit normalized. For each array, a logit transformation was performed followed by a Z-transformation to mean zero and SD1 and correlate with growth inhibition (log(GI50)). Download sPLA from the National Cancer Institute 2 Growth inhibition data of hydrolyzable, cisplatin-containing liposomes against the same cell line. The expression of each gene in each cell line correlated with the growth (log(GI50)) of those cell lines in the presence of liposomes. Covariance (Pearson's correlation coefficient multiplied by standard deviation) was then determined to identify genes positively and negatively associated with sensitivity to liposomes. Tables 3 and 4 show the top positive...
example 3
[0296] Example 3. Prediction of sPLA in different cancer patient populations 2 Reactivity of hydrolyzable, cisplatin-containing liposomes.
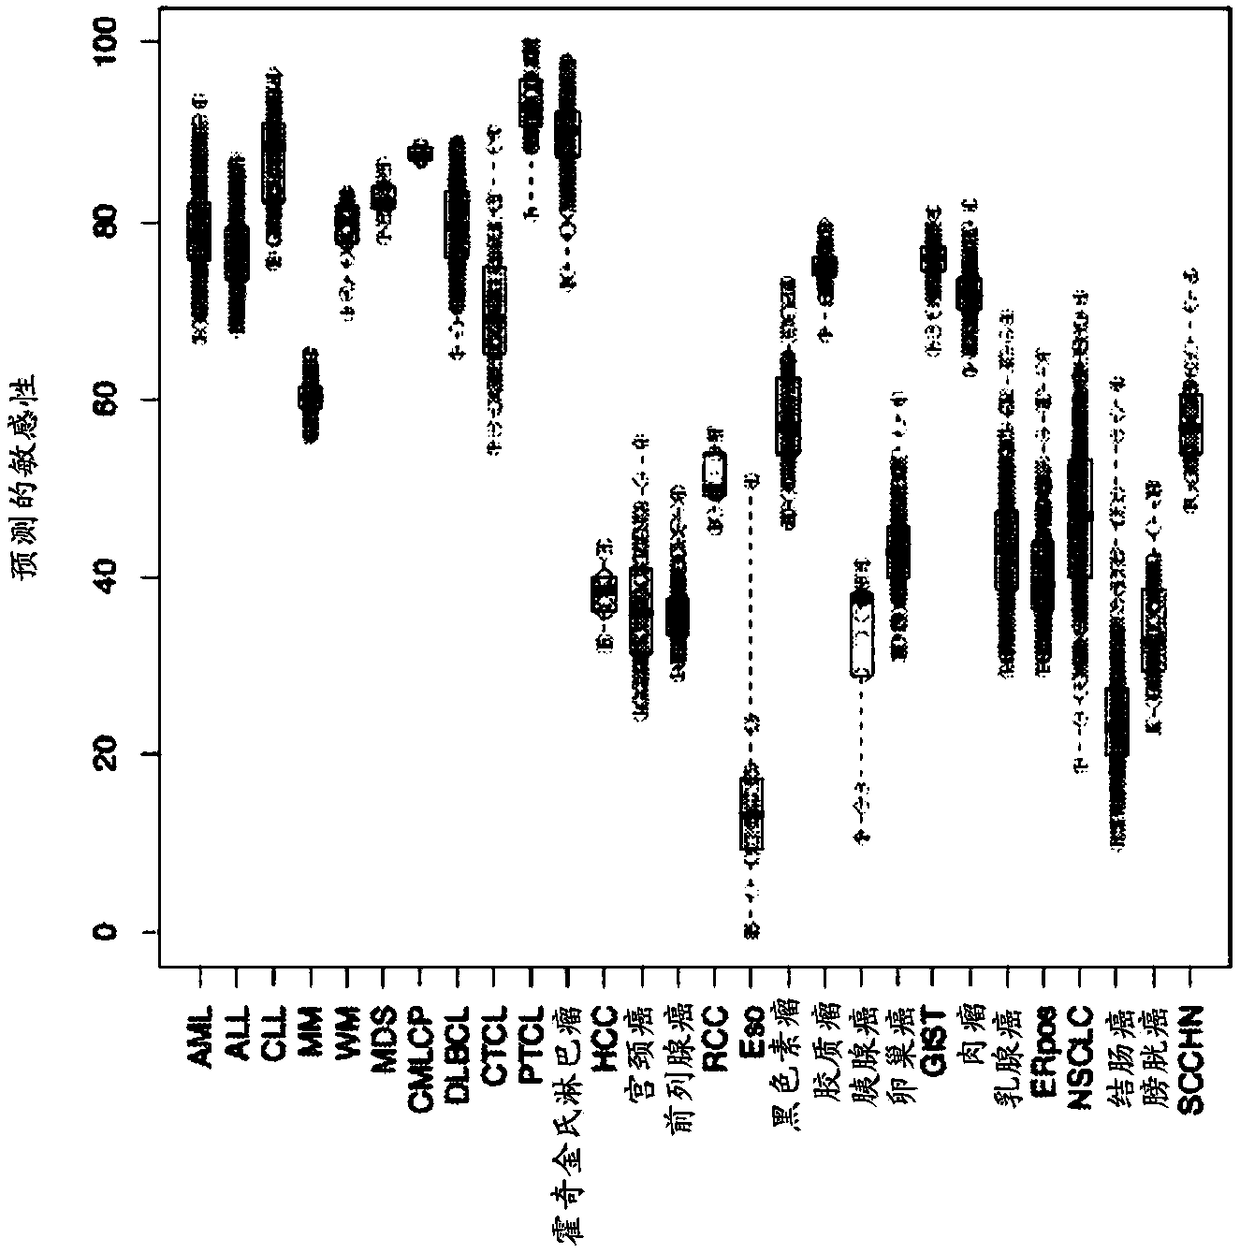
[0297] The pair sPLA developed according to the method of the present invention 2 An mRNA-based predictor of reactivity to hydrolyzable, cisplatin-containing liposomes was applied to 3,522 patients with various cancers. Pre-treatment measurements of gene expression were performed on each patient with the Affilix array. The predicted liposome sensitivity for each patient was calculated as the mean of the levels of biomarkers with sensitivity (Table 1) and the levels of biomarkers with resistance (Table 2) for that patient the difference between the values. When patients were grouped by cancer type, and cancer types predicted to be more responsive to liposomes were identified ( figure 1 ). Across 27 different cancer types, patients with blood cancer types were predicted to respond better to liposomal therapy than patients with solid tu...
PUM
 Abstract
Description
Claims
Application Information
 - R&D Engineer
- R&D Manager
- IP Professional
- Industry Leading Data Capabilities
- Powerful AI technology
- Patent DNA Extraction
Browse by: Latest US Patents, China's latest patents, Technical Efficacy Thesaurus, Application Domain, Technology Topic, Popular Technical Reports.
© 2024 PatSnap. All rights reserved.Legal|Privacy policy|Modern Slavery Act Transparency Statement|Sitemap|About US| Contact US: help@patsnap.com


