Multi-dimensional data dependency visual analyzing method and system based on dimension projection

A technology of multi-dimensional data and analysis methods, applied in visual data mining, electronic digital data processing, structured data retrieval, etc., can solve problems such as loss of original dimensional information

Active Publication Date: 2018-05-11
BEIJING TECHNOLOGY AND BUSINESS UNIVERSITY
View PDF5 Cites 18 Cited by
  • Summary
  • Abstract
  • Description
  • Claims
  • Application Information

AI Technical Summary

Problems solved by technology

However, the problem with this type of method is that the user has little control over the dimensionality reduction process, and after dimensionality reduction, the original dimension information will be lost
It can be seen from this that the mining methods and visualization techniques for high-dimensional data correlation are also facing many challenges.

Method used


Image

  • Multi-dimensional data dependency visual analyzing method and system based on dimension projection
  • Multi-dimensional data dependency visual analyzing method and system based on dimension projection
  • Multi-dimensional data dependency visual analyzing method and system based on dimension projection

Examples


Embodiment Construction

[0074] Below in conjunction with accompanying drawing, further describe the present invention through embodiment, but do not limit the scope of the present invention in any way.

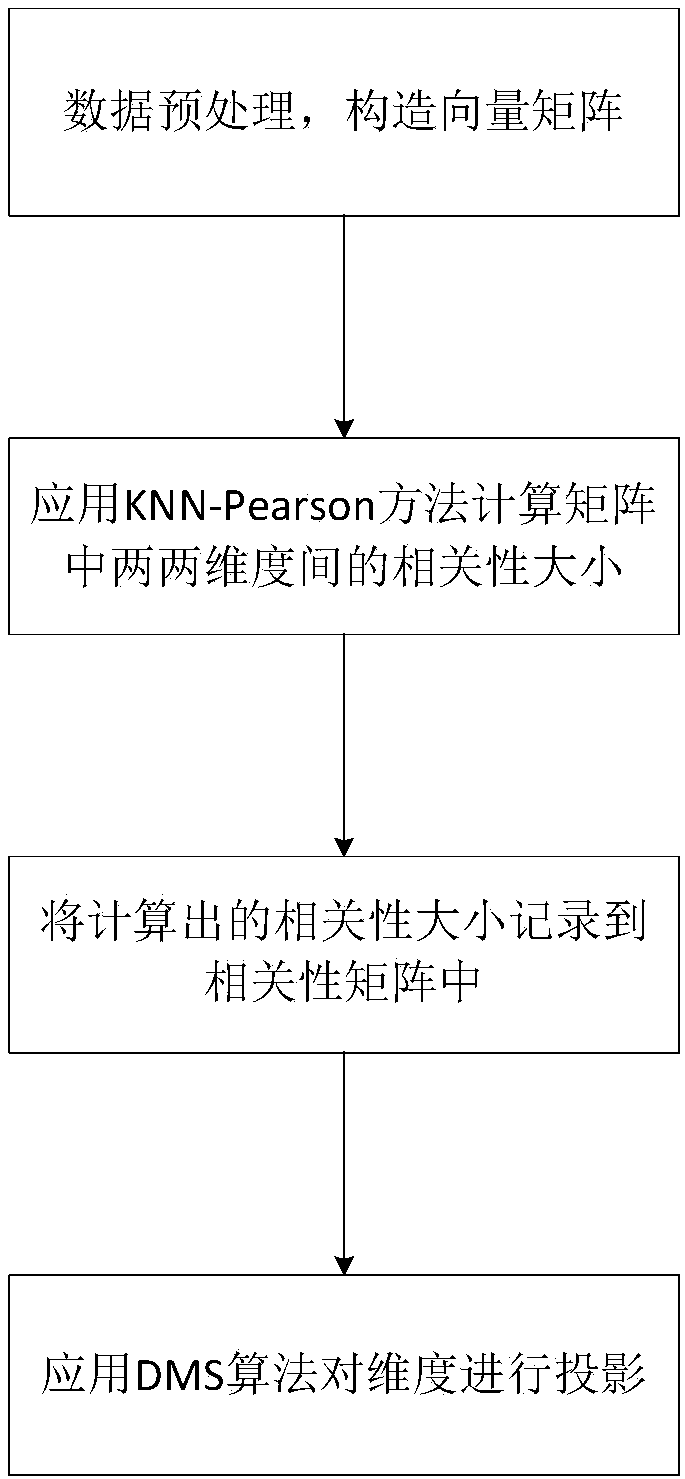
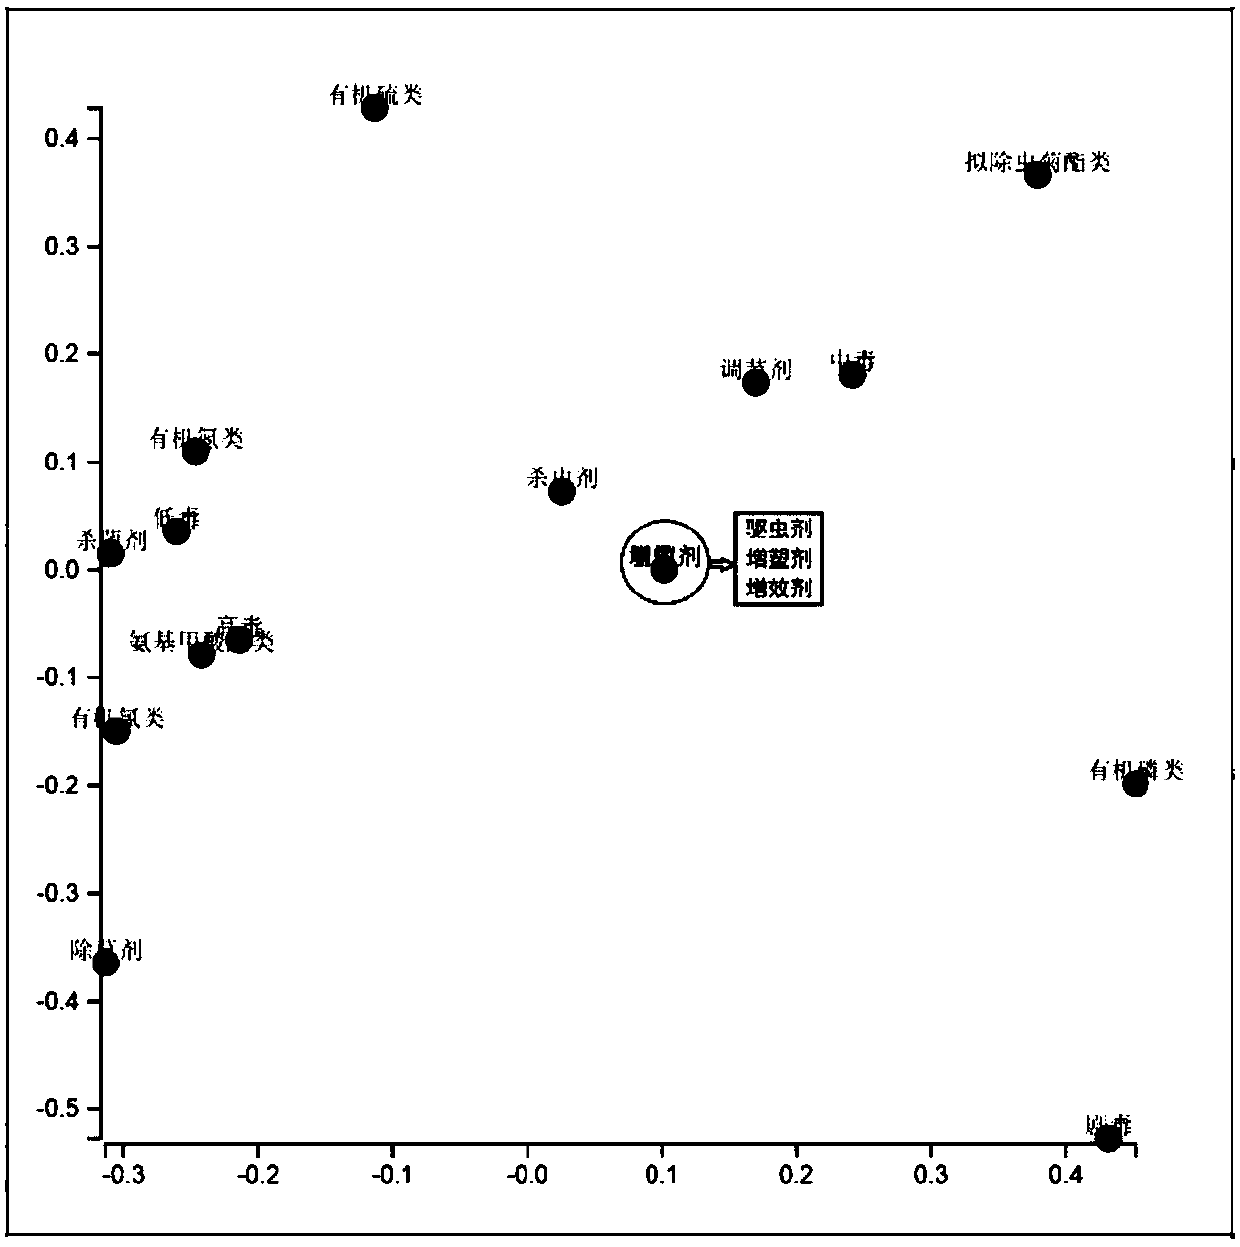
[0075]The present invention provides a multi-dimensional data visual analysis method and system based on dimension projection. The visual analysis method is applied to the display of the pesticide residue data set (hereinafter referred to as the pesticide residue data). According to the different characteristics of the pesticide residue data, Use the knowledge of relevant data analysis and data visualization to explore and analyze pesticide residue data with multi-dimensional attributes, especially for quantitative analysis of the correlation between attributes in the data. At the same time, it is supplemented by a variety of interactive means, so that users can independently select the data of interest for analysis.

[0076] The existing traditional method for calculating the correlation between dim...


PUM


Abstract

The invention discloses a multi-dimensional data dependency visual analyzing method and system based on dimension projection and application, and belongs to the technical field of data analysis and visualization. The method includes the steps of establishing a KNN-Pearson measurement method to calculate the dependency of multi-dimensional data concentration dimensions, conducting formalized description and operation on multi-dimensional data sets through a matrix, and conducting quantitative calculation on the dependency of the data set dimensions to obtain a dimension dependency matrix R of multi-dimensional data. Through the visual method of projecting the data dimensions to display the dependency of the data dimensions, the dependency of the data dimensions is visualized. The multi-dimensional data dependency visual analyzing system comprises a data preprocessing module, a dimension dependency calculating module, a dimension dependency matrix heat map visualization module, a multi-dimensional property MDS projection module and a multi-view visualization and interaction module. The multi-dimensional data dependency visual analyzing system is applied for visual displaying and analyzing of pesticide residual data sets.

Description

technical field [0001] The present invention relates to the technical field of data analysis and visualization, in particular to a visual analysis method, system and application of multi-dimensional data correlation based on dimension projection. Background technique [0002] Pesticide residues are one of the main causes of food safety problems. Every year, governments of various countries conduct multiple random inspections and detections of pesticide residues in food, thus obtaining a large amount of data on pesticide residue detection data sets. This data set has multi-dimensional attributes. , and there is a certain correlation between each attribute, how to effectively analyze these data, especially the correlation analysis, to find out the potential correlation between each attribute, so as to formulate effective regulatory measures, is an urgent problem to be solved. [0003] The current visualization technology for the correlation between attributes in high-dimension...

Claims


Application Information

Patent Timeline
Patent Type & Authority Applications(China)
IPC IPC(8): G06F17/30
CPCG06F16/26
Inventor 陈谊张聪章蓉
Owner BEIJING TECHNOLOGY AND BUSINESS UNIVERSITY
Why Eureka
Try Eureka