Method for detecting BCR-ABL inhibitor resistance-related mutations, and data acquisition method for predicting resistance to BCR-ABL inhibitor using said method
A resistance-related and detection method technology is applied in the detection of BCR-ABL inhibitor resistance-related mutations and the data acquisition field using the detection for predicting BCR-ABL inhibitor resistance, which can solve the problem that mutations cannot be accurately performed detection, etc.
- Summary
- Abstract
- Description
- Claims
- Application Information
AI Technical Summary
Problems solved by technology
Method used
Image
Examples
Embodiment 1
[0065]
[0066] In this example, five samples summarized in the table below were prepared.
[0067] [Table 1]
[0068]
[0069]
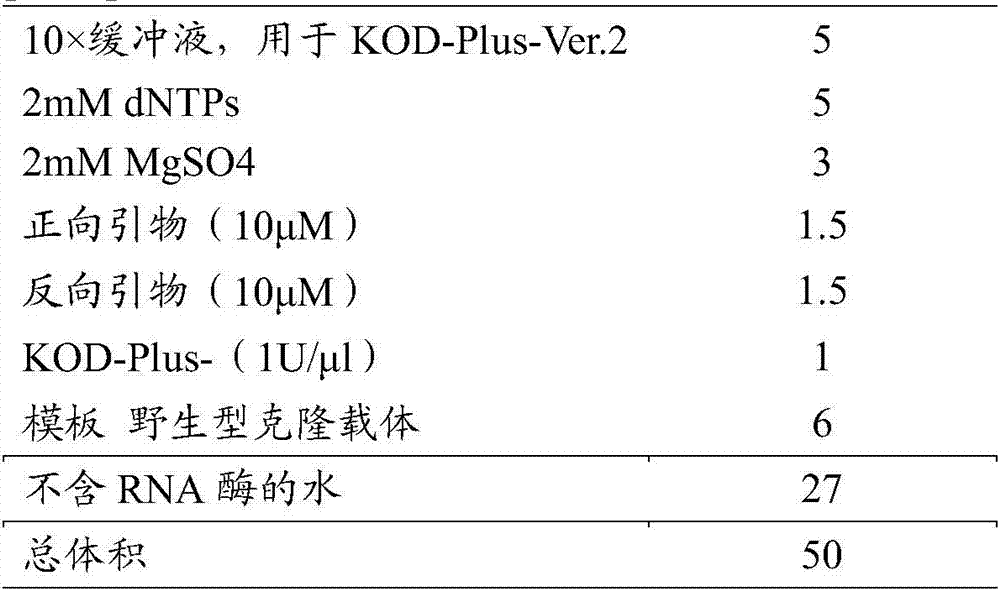
[0070] The cell line K562 was cultured, and the cells were confirmed to be 1.25×10 using a TC20 automatic cell counter (manufactured by Bio-Rad). 6 individual / mL. Add 10 mL of culture medium to a 15 mL centrifuge tube, and centrifuge at 300×g for 5 minutes to form a precipitate. After the supernatant was carefully and completely removed, RNA was extracted using RNeasy Mini Kit (manufactured by QIAGEN). The RNA concentration was measured using NanoDrop 2000 (manufactured by Thermo Fisher Scientific).
[0071]
[0072] The cell line HL60 was cultured, and RNA was extracted using the RNeasy Mini Kit (manufactured by QIAGEN) in the same manner as in the preparation of Sample 1. The RNA concentration was measured using NanoDrop 2000 (manufactured by Thermo Fisher Scientific).
[0073]
[0074] Using 2 mg of total RNA extracted from the ce...
Embodiment 2-2
[0122] [Example 2-2] Evaluation of primer pairs
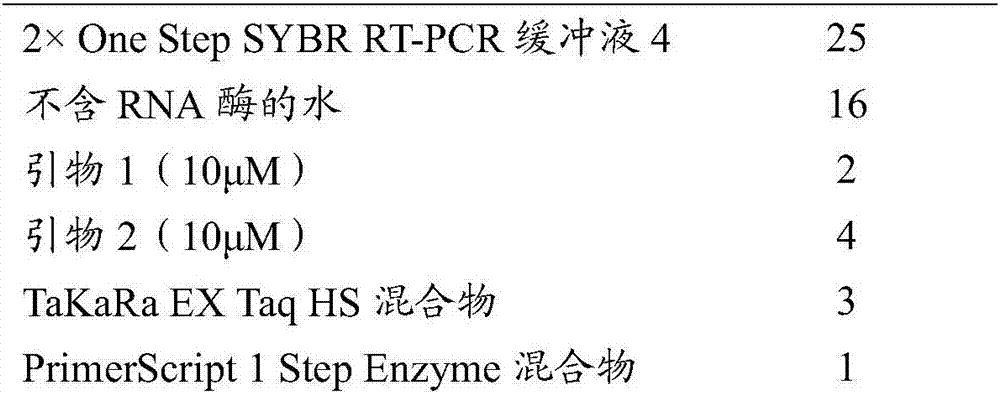
[0123] In this example, the total amount of sample 3 and sample 4 mixed was set to 10 ng, and the mixed samples at ratios of 100:0, 50:50, and 0:100 were used as templates, respectively. In addition, the hybridization reaction by PCR and a DNA chip, the subsequent fluorescence detection, etc. were performed in the same manner as in Example 1-1.
[0124] Table 7 shows the results of fluorescence intensity measurements using primer pair A and primer pair B in samples 3 and 4 that do not contain the normal cell-derived c-ABL gene, respectively. As shown in Table 7, in both cases when primer pair A and primer pair B were used, a correlation was obtained between the mixing ratio of the sample mixed as the template and the mutation ratio based on the signal intensity.
[0125] [Table 7]
[0126]
[0127]
Embodiment 2-3
[0128] [Example 2-3] Evaluation of primer pairs
[0129]In this example, 1 ng of sample 4 and 100 ng of sample 2 were added as templates. In addition, the hybridization reaction by PCR and a DNA chip, the subsequent fluorescence detection, etc. were performed in the same manner as in Example 1-1.
[0130] Table 8 shows the results of measuring the fluorescence intensity using primer pair A and primer pair B when sample 2 containing the c-ABL gene derived from normal cells is included. As shown in Table 8 below, when primer pair A is used, the mutation ratio (mutant type: 100%) of the BCR-ABL fusion gene used as a template is correlated with the detected signal intensity. On the other hand, when primer pair B was used, the ratio of mutations mixed as a template and the signal intensity of detection were reversed, and it was found that it was greatly affected by the sample 2 that did not have the BCR-ABL fusion gene. From this, it can be seen that when the primer pair A is use...
PUM
 Abstract
Description
Claims
Application Information
 - R&D
- Intellectual Property
- Life Sciences
- Materials
- Tech Scout
- Unparalleled Data Quality
- Higher Quality Content
- 60% Fewer Hallucinations
Browse by: Latest US Patents, China's latest patents, Technical Efficacy Thesaurus, Application Domain, Technology Topic, Popular Technical Reports.
© 2025 PatSnap. All rights reserved.Legal|Privacy policy|Modern Slavery Act Transparency Statement|Sitemap|About US| Contact US: help@patsnap.com


