Index comprehensive display method

A technology of indicators and massive data, applied in the direction of instruments, data processing applications, information technology support systems, etc., can solve the problems of increased data scale and processing pressure, a large number of manpower, and low accuracy, and achieve the effect of improving the quality of decision-making

Inactive Publication Date: 2017-08-11
CHINA ELECTRIC POWER RES INST +3
View PDF3 Cites 2 Cited by
  • Summary
  • Abstract
  • Description
  • Claims
  • Application Information

AI Technical Summary

Problems solved by technology

[0003] With the large-scale construction of the UHV AC-DC hybrid power grid and the comprehensive advancement of the "large-scale operation" system, the service scope of the power grid dispatching control system is rapidly expanding, the data sources are increasing, the data types are diverse, and the data scale and processing pressure are increasing sharply. The requirements for

Method used


Image

  • Index comprehensive display method
  • Index comprehensive display method

Examples


Embodiment Construction

[0032] In order to better understand the present invention, the content of the present invention will be further described below in conjunction with the accompanying drawings and specific embodiments.

[0033] The present invention provides a method for comprehensively displaying indicators, and the method includes the following steps:

[0034] I. Using indicators and power grid information visualization display technology;

[0035] II. Use massive data mining and drilling analysis technology;

[0036] III. Apply typical business theme analysis techniques.

[0037] The step I includes: using a visual display method to interactively display indicators and grid information.

[0038] The visualizations include:

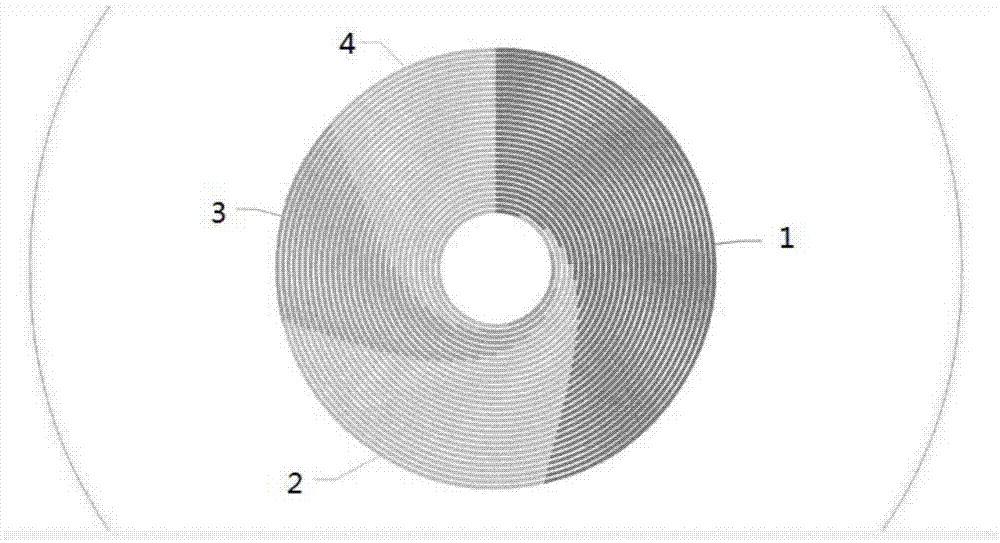
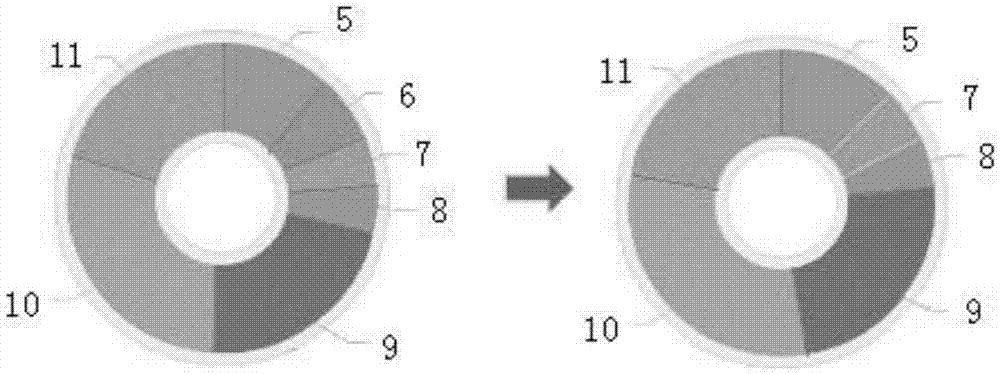
[0039] 1) Use the method of green, yellow and red indicator lights to indicate the level of the indicator value relative to the historical statistical situation, and intuitively display the status of the single indicator; the status is divided into healthy, normal, an...


PUM


Abstract

The invention relates to an index comprehensive display method. The method comprises the following steps of I, applying an index and power network information visual display technology; II, applying a massive data mining and drilling analysis technology; and III, applying a typical business topic analysis technology. According to the comprehensive analysis method provided by the invention, logic, interconnected and interactive visual display of power network operation information and various decision-making assistant information is effectively realized in combination with power network regulation business data characteristics and power network operation analysis results; complete information and technical support are provided for timely mastering overall conditions and real and accurate field conditions of power network production and carrying out scientific decision-making; and the data mining technology is introduced for analyzing and processing power network data, and system data is converted into valuable knowledge to assist decision-making and management personnel to perform data analysis and decision making, so that the decision-making quality is improved and the potential value of the power network data is fully mined.

Description

technical field [0001] The invention belongs to the technical field of electric power automation, and specifically relates to a method for comprehensively displaying indicators. Background technique [0002] The power grid operation index is an important basis to reflect the current power grid operation, measure the power grid dispatching or monitor the business status. Social production and life rely more and more on electricity. The safety, reliability, economy, and high-quality supply of electricity are directly related to the national economy, people's livelihood, and economic development. In recent years, a series of blackouts have brought serious economic development At the same time, it greatly affects the normal production and life of the people, and the security and stability of the power grid is of great importance. [0003] With the large-scale construction of the UHV AC-DC hybrid power grid and the comprehensive advancement of the "large-scale operation" system,...

Claims


Application Information

Patent Timeline
IPC IPC(8): G06Q10/06G06Q50/06
CPCG06Q10/06393G06Q50/06Y04S10/50
Inventor 陶蕾周小明李大鹏李功新黄文英林静怀陈郑平陈雪净狄方春李立新
Owner CHINA ELECTRIC POWER RES INST
Why Eureka
Try Eureka