
Method for reconstructing, displaying and analyzing engine test data three-dimensional waterfall plot

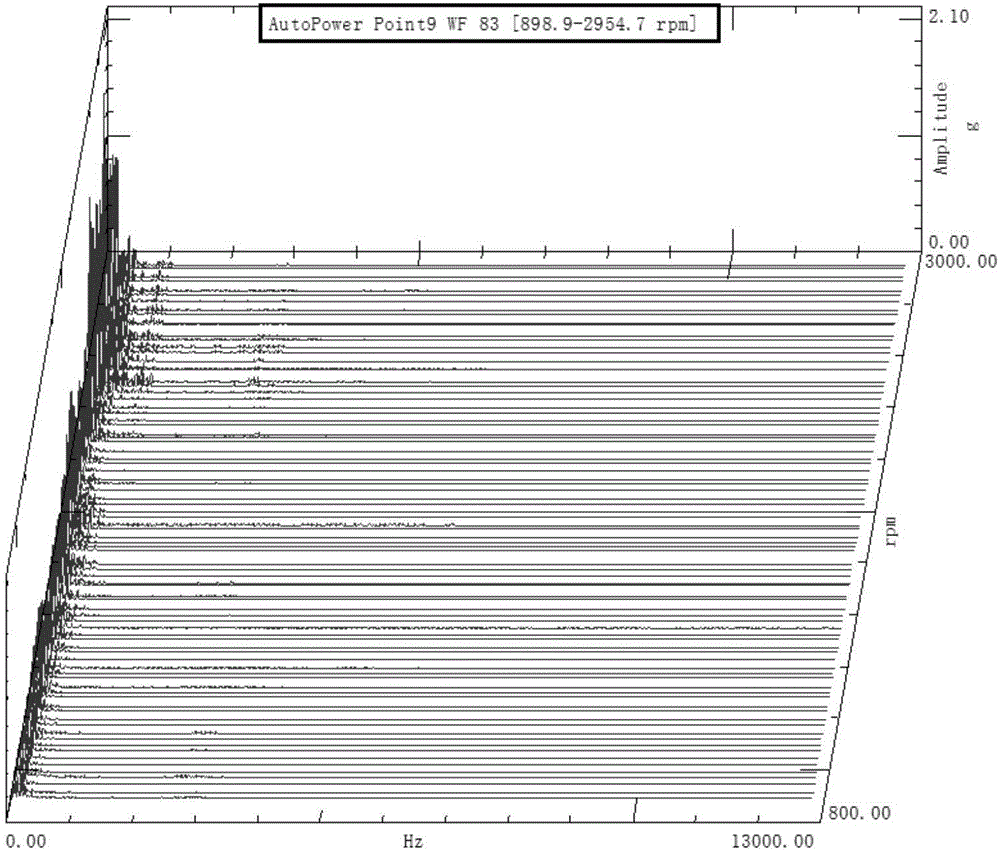
A technology of test data and analysis method, which is applied in the aerospace test and aviation fields, and can solve problems such as inconvenient analysis and processing, poor discrimination, and aliasing of monochrome three-dimensional waterfall image spectrum data display.

Active Publication Date: 2017-03-08
XIAN AEROSPACE PROPULSION TESTING TECHN INST
View PDF5 Cites 7 Cited by
  • Summary
  • Abstract
  • Description
  • Claims
  • Application Information

AI Technical Summary

Problems solved by technology

[0007] In order to solve the problems in the background technology, the present invention provides a method for rebuilding, displaying and analyzing the three-dimensional waterfall diagram of engine test data, which solves the display of the monochromatic three-dimensional waterfall diagram spectrum data automatically generated by the Desktop-Advanced software of the current LMS Test.Lab Rev The defects of aliasing, fuzzy display effect and weak discrimination have solved the problem that it is not convenient for operators to analyze and process

Method used


Image

  • Method for reconstructing, displaying and analyzing engine test data three-dimensional waterfall plot
  • Method for reconstructing, displaying and analyzing engine test data three-dimensional waterfall plot
  • Method for reconstructing, displaying and analyzing engine test data three-dimensional waterfall plot

Examples


Embodiment Construction

[0048] The present invention will be described in further detail below.

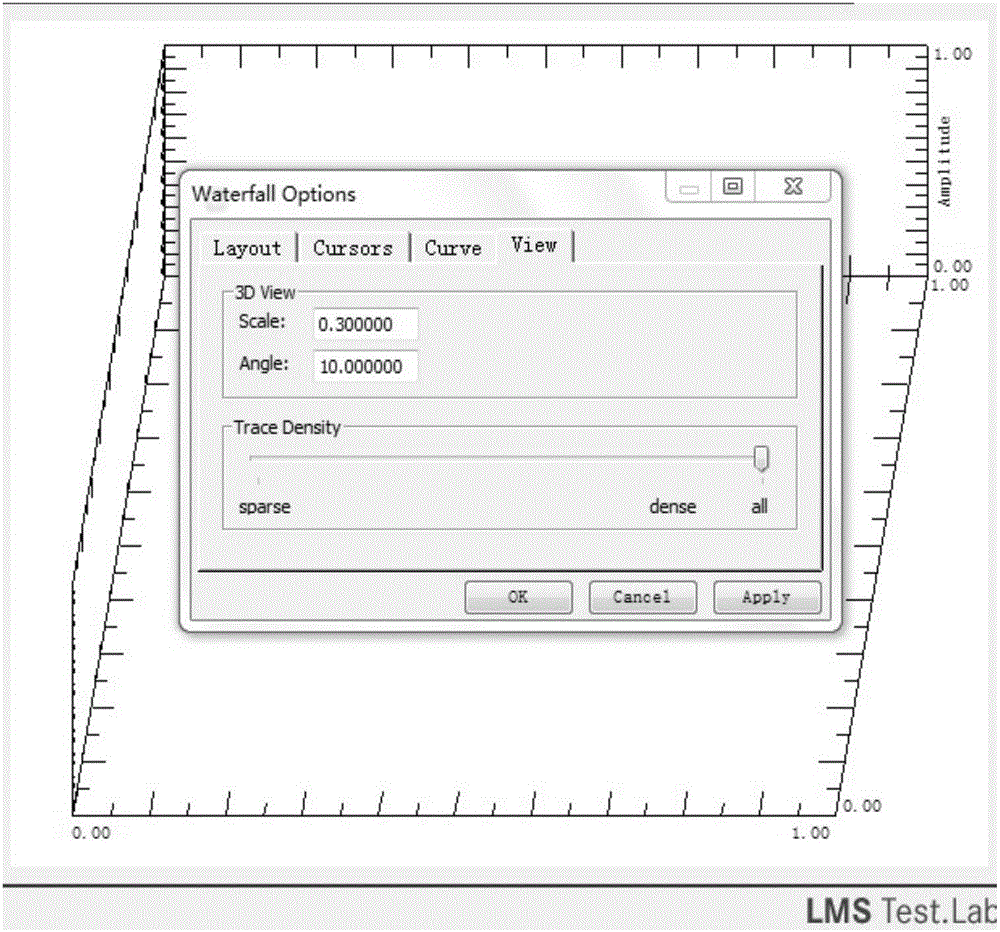
[0049] The invention not only solves the disadvantage that the LMS Test.Lab Rev software can only modify the viewing angle parameters in the property dialog box, which is inconvenient for users to view data flexibly, but also solves the problem of data display aliasing, blurred display effect, and discrimination of monochromatic three-dimensional waterfall diagrams. In order to obtain a better user experience and ensure the high efficiency of the three-dimensional waterfall diagram data display in the field of vibration and noise measurement sex, reliability.

[0050] The system of the present invention is developed based on the existing LMS Test.Lab Rev software, Figure 10 It is an algorithm flow chart for reconstructing a three-dimensional waterfall diagram, wherein details of the three-dimensional waterfall diagram reconstruction are described in detail, and the method steps include:

[0051] Step ...


PUM


Abstract

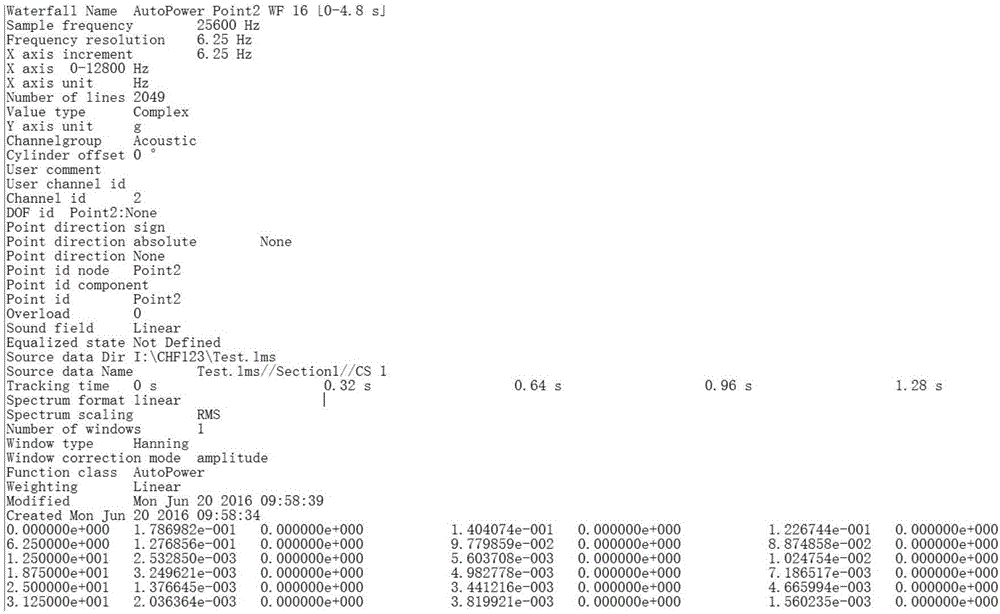
The invention belongs to the technical field of aerospace experiments, and particularly relates to a method for reconstructing, displaying and analyzing an engine test data three-dimensional waterfall plot. The method comprises the main steps of: 1, exporting a text-format file from an original three-dimensional waterfall plot of Desktop-Advanced software of LMS Test.Lab Rev; 2, reading amplitude column data in spectrum data from the text-format file; 3, storing the spectrum data as a two-dimensional array; and 4, reconstructing a three-dimensional waterfall plot and carrying out display and analysis, wherein an analysis method comprises analysis steps of extracting data by spectral slices, carrying out dynamic perspective viewing, carrying out data comparison and the like. By the method disclosed by the invention, the defects of display aliasing, fuzzy display effect and poor discrimination of spectrum data of a single-color three-dimensional waterfall plot automatically generated by Desktop-Advanced software of a current LMS Test.Lab Rev are overcome, and the problem of inconvenience for an operator to carry out analysis processing is solved.

Description

technical field [0001] The invention belongs to the technical field of aviation and aerospace tests, and in particular relates to a method for rebuilding, displaying and analyzing three-dimensional waterfall diagrams of engine test data. Background technique [0002] The analysis of three-dimensional vibration spectrum data after the rocket engine test is a necessary means for engine performance evaluation and fault diagnosis, and the three-dimensional three-dimensional waterfall diagram with time, frequency and amplitude as coordinates is a common spectrum analysis diagram. [0003] The current method of displaying the three-dimensional waterfall diagram in the LMS Test.Lab Rev software is as follows: 1. Start the Desktop-Advanced software of LMSTest.Lab Rev, and make a three-dimensional waterfall diagram for the collected data. 2. Manually drag any one of the N parameters (N>0) in the Name column under the Navigator view to the 1×1 3D waterfall display window, and the d...

Claims


Application Information

Patent Timeline
IPC IPC(8): G06F17/50
CPCG06F30/00
Inventor 高林刘英元乔江晖赵政社左明聪朱丹波赵建军宋涛朱成亮赵纳王军红李恒刘军姚羽佳李峰翟文化
Owner XIAN AEROSPACE PROPULSION TESTING TECHN INST
Learn More