
Pie chart rendering method and apparatus thereof

A pie chart, target direction technology, applied in the field of image drawing, can solve the problem of long rendering time, and achieve the effect of reducing rendering time and rendering speed.

Inactive Publication Date: 2017-01-18
福建中金在线信息科技有限公司
View PDF4 Cites 5 Cited by
  • Summary
  • Abstract
  • Description
  • Claims
  • Application Information

AI Technical Summary

Problems solved by technology

[0005] In the existing pie chart drawing method, in the rendering process, since the 360-degree initialization pie chart needs to be gradually rendered, the rendering time is relatively long

Method used


Image

  • Pie chart rendering method and apparatus thereof
  • Pie chart rendering method and apparatus thereof
  • Pie chart rendering method and apparatus thereof

Examples


Embodiment 1

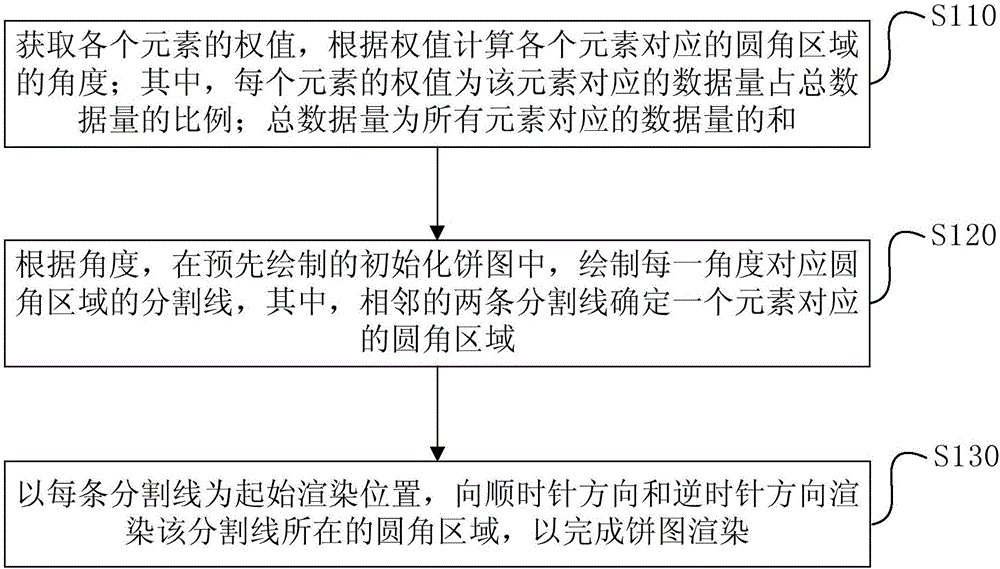
[0059] Such as figure 1 Shown is a flowchart of a pie chart rendering method provided by an embodiment of the present invention. The method is applied to a terminal device and includes:

[0060] S110. Obtain the weight of each element, and calculate the angle of the rounded area corresponding to each element according to the weight; wherein the weight of each element is the ratio of the data volume corresponding to the element to the total data volume; The amount of data is the sum of the amount of data corresponding to all elements.

[0061] In this embodiment, elements can be understood as categories that divide things. For example, novels, essays, and poems are different categories of articles. The amount of data corresponding to an element is the number of things in different categories. For example, the number of novels, the number of essays, and the number of poems.

[0062] Specifically, the weight of each element can be calculated by the following method:

[0063] After det...

Embodiment 2

[0097] Such as Figure 5 As shown, it is a schematic structural diagram of a pie chart rendering apparatus provided by an embodiment of the present invention, which is used to perform such as figure 1 In the method, the device includes:

[0098] The angle calculation module 510 is configured to obtain the weight of each element, and calculate the angle of the rounded area corresponding to each element according to the weight; wherein the weight of each element is the amount of data corresponding to the element in the total amount of data Proportion; the total data volume is the sum of the data volumes corresponding to all elements;

[0099] The dividing line drawing module 520 is configured to draw a dividing line corresponding to the rounded corner area at each angle in the pre-drawn initialization pie chart according to the angle, wherein two adjacent dividing lines determine the rounded corner corresponding to an element area;

[0100] The rounded area rendering module 530 is con...


PUM


Abstract

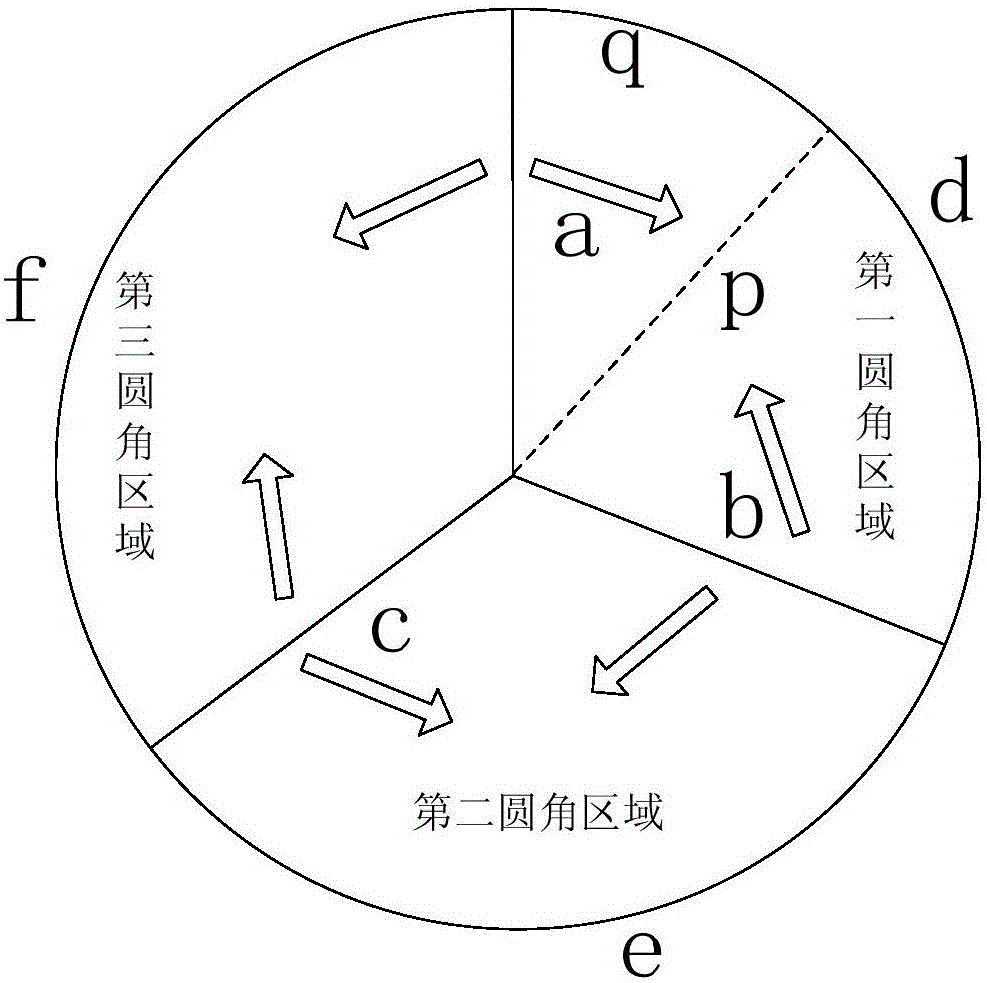
Embodiments of the invention provide a pie chart rendering method and an apparatus thereof. The method comprises the following steps of acquiring a weight of each element and calculating an angle of a fillet area corresponding to each element according to the weight, wherein the weight of each element is a proportion of a data size corresponding to the element to a total data size, and the total data size is a sum of the data sizes corresponding to all the elements; according to the angle, in an initial pie chart which is drawn in advance, drawing a segmentation wire of the fillet area corresponding to each angle, wherein the two adjacent segmentation wires determine the fillet area corresponding to one element; taking each segmentation wire as an initial rendering position and rendering the fillet area where the segmentation wire is located along a clockwise direction and an anti-clockwise direction so as to complete pie chart rendering. In the embodiments of the invention, through drawing the segmentation wires in an initialized pie chart, the fillet area is formed; and each segmentation wire is taken as the initial rendering position and parallel rendering is performed on the fillet area along the clockwise direction and the anti-clockwise direction. By using the method, a rendering speed is fast and rendering time is shortened.

Description

Technical field [0001] The present invention relates to the technical field of image rendering, in particular to a pie chart rendering method and device. Background technique [0002] With the development of the Internet, people have higher and higher requirements for data processing. How to display a large amount of data intuitively in front of users has become an important research topic. [0003] Because the pie chart can intuitively show the user the information of the various elements that make up the graphic, it has been more and more used in practical applications. Specifically, a pie chart is a graph that can intuitively express the proportion of data corresponding to each element to all data. For example, among 100 people, those who are more than 30 years old are 60 people, and those who are less than 30 years old are 40 people. Then the elements are "persons greater than 30 years old" and "persons less than 30 years old", and the amount of data corresponding to the two ...

Claims


Application Information

Patent Timeline
Patent Type & Authority Applications(China)
IPC IPC(8): G06T11/20G06T11/40
CPCG06T11/206G06T11/40
Inventor 沈文策
Owner 福建中金在线信息科技有限公司
Learn More