
Electric power big data visualization oriented data mining method

A data mining and big data technology, applied in data processing applications, market data collection, instruments, etc.

Inactive Publication Date: 2016-04-13
STATE GRID TIANJIN ELECTRIC POWER +1
View PDF0 Cites 13 Cited by
  • Summary
  • Abstract
  • Description
  • Claims
  • Application Information

AI Technical Summary

Problems solved by technology

However, there is still a lack of effective data mining methods for power big data visualization.

Method used


Image

  • Electric power big data visualization oriented data mining method
  • Electric power big data visualization oriented data mining method
  • Electric power big data visualization oriented data mining method

Examples


Embodiment Construction

[0044] The data mining method for electric power big data visualization provided by the present invention will be described in detail below with reference to the accompanying drawings and specific embodiments.

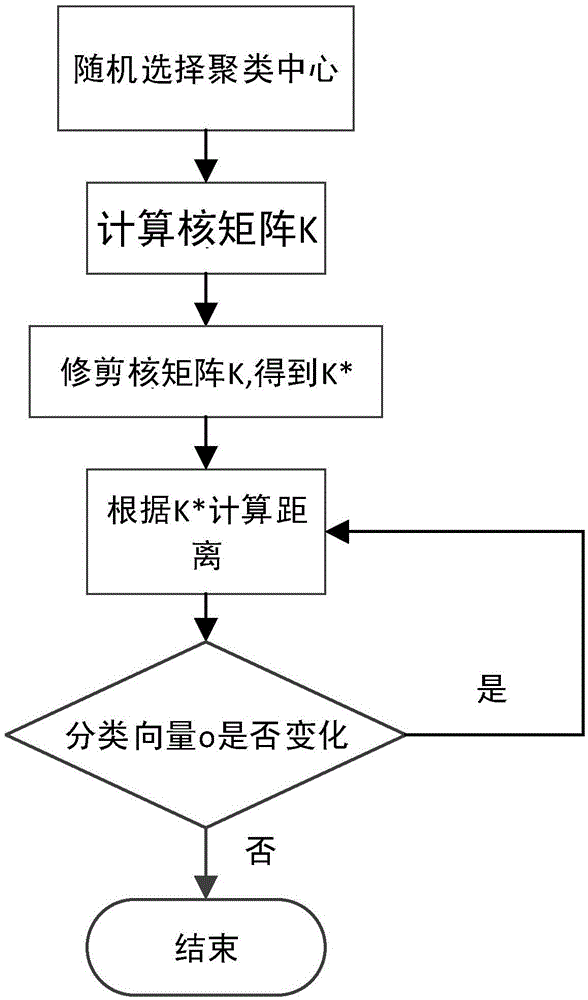
[0045] Such as figure 1 As shown, the data mining method for electric power big data visualization provided by the present invention includes the following steps executed in sequence:

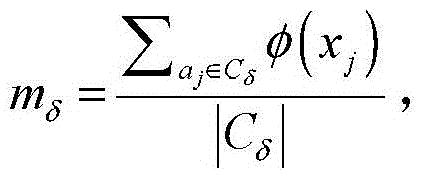
[0046] Step 1) Get the collected data from a 1 ,a 2 ,...,A n Electricity marketing data set A composed of n data samples, of which data sample a i Is a multi-dimensional vector, divide the data clusters in the above n data samples into k categories, respectively C 1 ,C 2 ,...,C k , And then use the kernel function to map the divided data into the kernel space, and determine the center m of each cluster 1 ,m 2 ,...,M k ;

[0047] Step 2) Construct the kernel matrix corresponding to data set A: When calculating the dot product in the high-dimensional space, the kernel function is not calculated...


PUM


Abstract

The invention discloses an electric power big data visualization oriented data mining method, comprising obtaining an electric power marketing data set A composed of n collected data samples: a1, a2, and the like, an; classifying the data clusters in the n data samples into K classes; mapping the classified data to a kernel space through a kernel function; determining the center of every cluster; constructing a kernel matrix corresponding to the data set A; reducing the scale of the kernel matrix; constructing class vectors for all data samples aj; rapidly calculating distances according to the reduced kernel matrix K * obtained in the previous step; updating the class vectors so as to redetermine the class attributions of the data samples aj. According to the electric power big data visualization oriented data mining method provided by the invention, effective clustering and classifying analysis is carried out to the marketing data; the user group is identified well; the classified user power consumption features are obtained; therefore, the foundation is laid for electric power marketing intelligence.

Description

Technical field [0001] The invention belongs to the technical field of electric power big data data fusion and processing, and particularly relates to a data mining method oriented to electric power big data visualization. Background technique [0002] Electricity is related to economic development, social stability, and people's lives. Changes in electricity demand are the "barometer" and "weathervane" of economic operation, which can truly and objectively reflect the development and trend of the national economy. According to McKinsey's "Big Data: The Next New Frontier in Innovation, Competition, and Productivity" report released in May 2011, data has penetrated into every industry and business functional area, and has gradually become an important production factor. For the power industry, real-time production data such as operating conditions, parameters, and equipment operating status involved in power production, equipment monitoring data collected by fieldbus systems, and ...

Claims


Application Information

Patent Timeline
IPC IPC(8): G06Q10/06G06Q30/02G06Q50/06
CPCG06Q10/0637G06Q30/0201G06Q50/06
Inventor 章斌赵文清王扬何金赵长伟郭晓艳崔柏刘晨
Owner STATE GRID TIANJIN ELECTRIC POWER
Learn More