Optimization method for air quality information display on network map

An air quality and network map technology, applied in the field of network maps, can solve the problems of poor visual effect and poor air quality information effect, and achieve the effect of clear display

Active Publication Date: 2015-12-09
AIGO ELECTRONICS TECH
View PDF6 Cites 6 Cited by
  • Summary
  • Abstract
  • Description
  • Claims
  • Application Information

AI Technical Summary

Problems solved by technology

[0005] In order to solve the defects of poor air quality information displayed on the existing network map and poor visual effect, the present invention provides an optimization method for displaying air quality information on the network map, which avoids the conflict of different display data overlapping in the display area sex

Method used


Image

  • Optimization method for air quality information display on network map
  • Optimization method for air quality information display on network map
  • Optimization method for air quality information display on network map

Examples


Embodiment Construction

[0030] The specific content of the present invention will be explained and described in detail below in conjunction with the accompanying drawings.

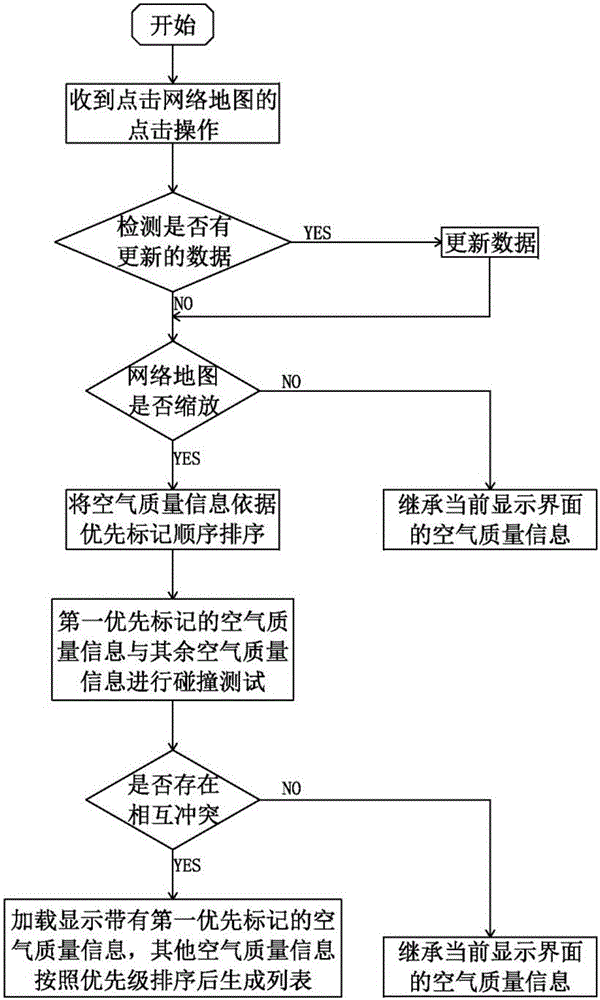
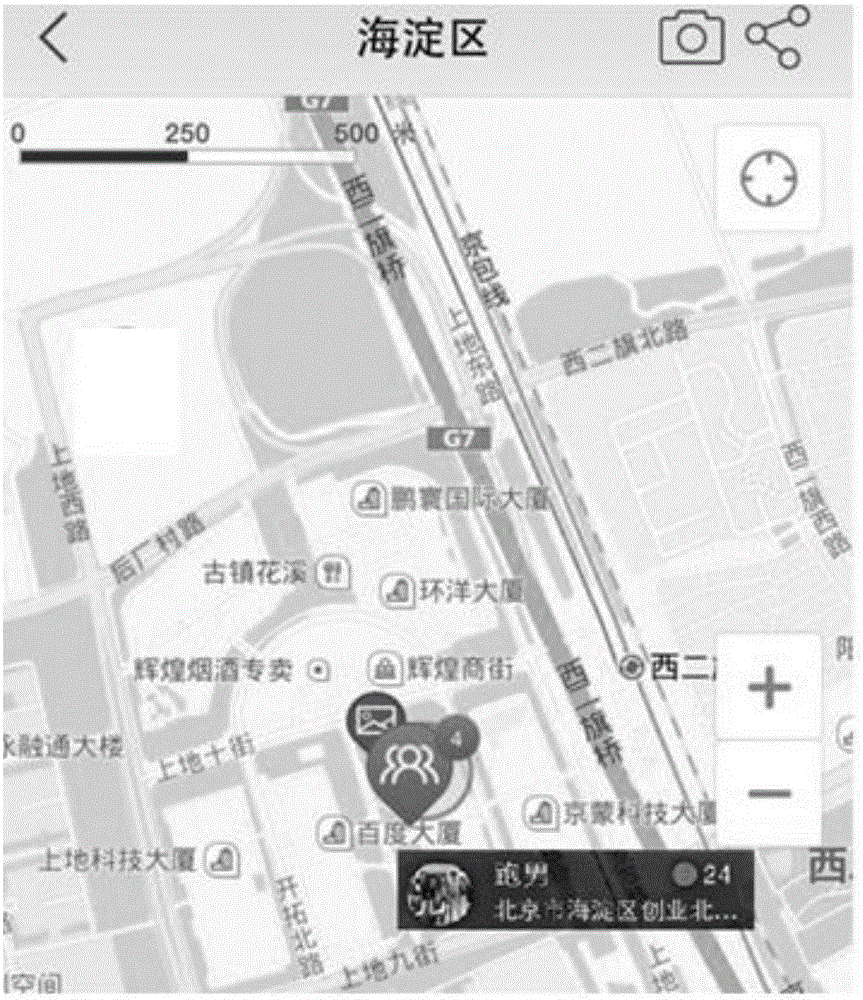
[0031] The present invention realizes the object of the invention of an optimization method for displaying air quality information on a network map through a network map display system. After performing corresponding operations on the network map, users can obtain the air quality information provided by the network map in real time, and inquire about the air quality conditions in different locations.

[0032] The network map display system includes: an air quality information detection terminal, a network map server and a network equipment terminal.

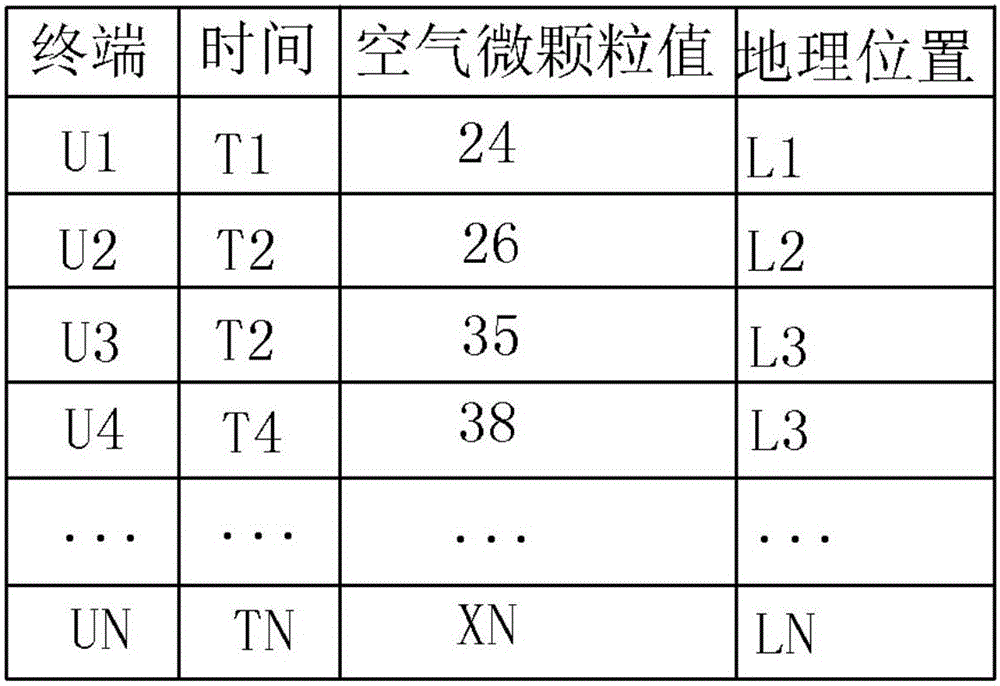
[0033] The air quality information detection terminal detects air quality conditions and generates air quality data. Specifically, the air quality information detection terminal can be used to detect fine particles such as PM2.5, CO 2 Other gas components, TVOC and other indoor or...


PUM


Abstract

The invention discloses an optimization method for air quality information display on a network map, and the method comprises the following steps: enabling air quality information to be ranked according to the priority marking sequence after a network map server receives a zooming operation instruction; carrying out the conflict detection of the air quality information with a first priority mark and other air quality information in a visible region of the network map at the zooming times; judging whether there is air quality data which conflicts with each other in the visible region or not through the conflict detection; inheriting the air quality information of a current display region if there is no air quality data which conflicts with each other in the visible region; and loading and displaying the air quality information with the first priority mark if there is air quality data which conflicts with each other in the visible region. The method solves a problem that the conflict among different data causes the overlapping of marking layers when the network map displays a plurality of pieces of different air quality data. The method achieves the independent display and priority ranking in the visible region through the conflict testing, and achieves a technical effect of clear display in the visible region of the network map.

Description

technical field [0001] The invention relates to the technical field of network maps, more specifically, an optimization method for displaying air quality information on a network map. Background technique [0002] At present, the technical solutions for real-time and accurate display of air quality information on the network map are not yet mature. Air quality data contains a lot of information. Therefore, when displaying a label layer within a certain visible area on a network map, especially after zooming in on the map, the information sources of air quality information are complex and large in number. , so it is easy to cause overlapping display areas, and it is difficult to distinguish the label layer, resulting in unclear interface display and poor visual effects. [0003] However, the prior art solutions to this problem are often ineffective, resulting in very low work efficiency of the network map and a decrease in user interface experience. [0004] Therefore, how ...

Claims


Application Information

Patent Timeline
Patent Type & Authority Applications(China)
IPC IPC(8): G09B29/00
Inventor 郭宏志王婕卿高山
Owner AIGO ELECTRONICS TECH
Why Eureka
Try Eureka