
Smart grid visualization platform and demonstration control method

A smart grid and control method technology, applied in the direction of instruments, data processing applications, user/computer interaction input/output, etc., to achieve the effect of rich and diverse visual display forms of smart grid, novel and vivid display concepts, and strong interaction

Inactive Publication Date: 2014-12-24
SHANGHAI FOREMOST MULTIMEDIA
View PDF5 Cites 11 Cited by
  • Summary
  • Abstract
  • Description
  • Claims
  • Application Information

AI Technical Summary

Problems solved by technology

[0004] The purpose of the present invention is to solve the defects existing in the visualization display of the power grid in the prior art. The present invention provides a smart grid visualization platform and a demonstration control method to overcome the defects

Method used


Image

  • Smart grid visualization platform and demonstration control method

Examples


Embodiment Construction

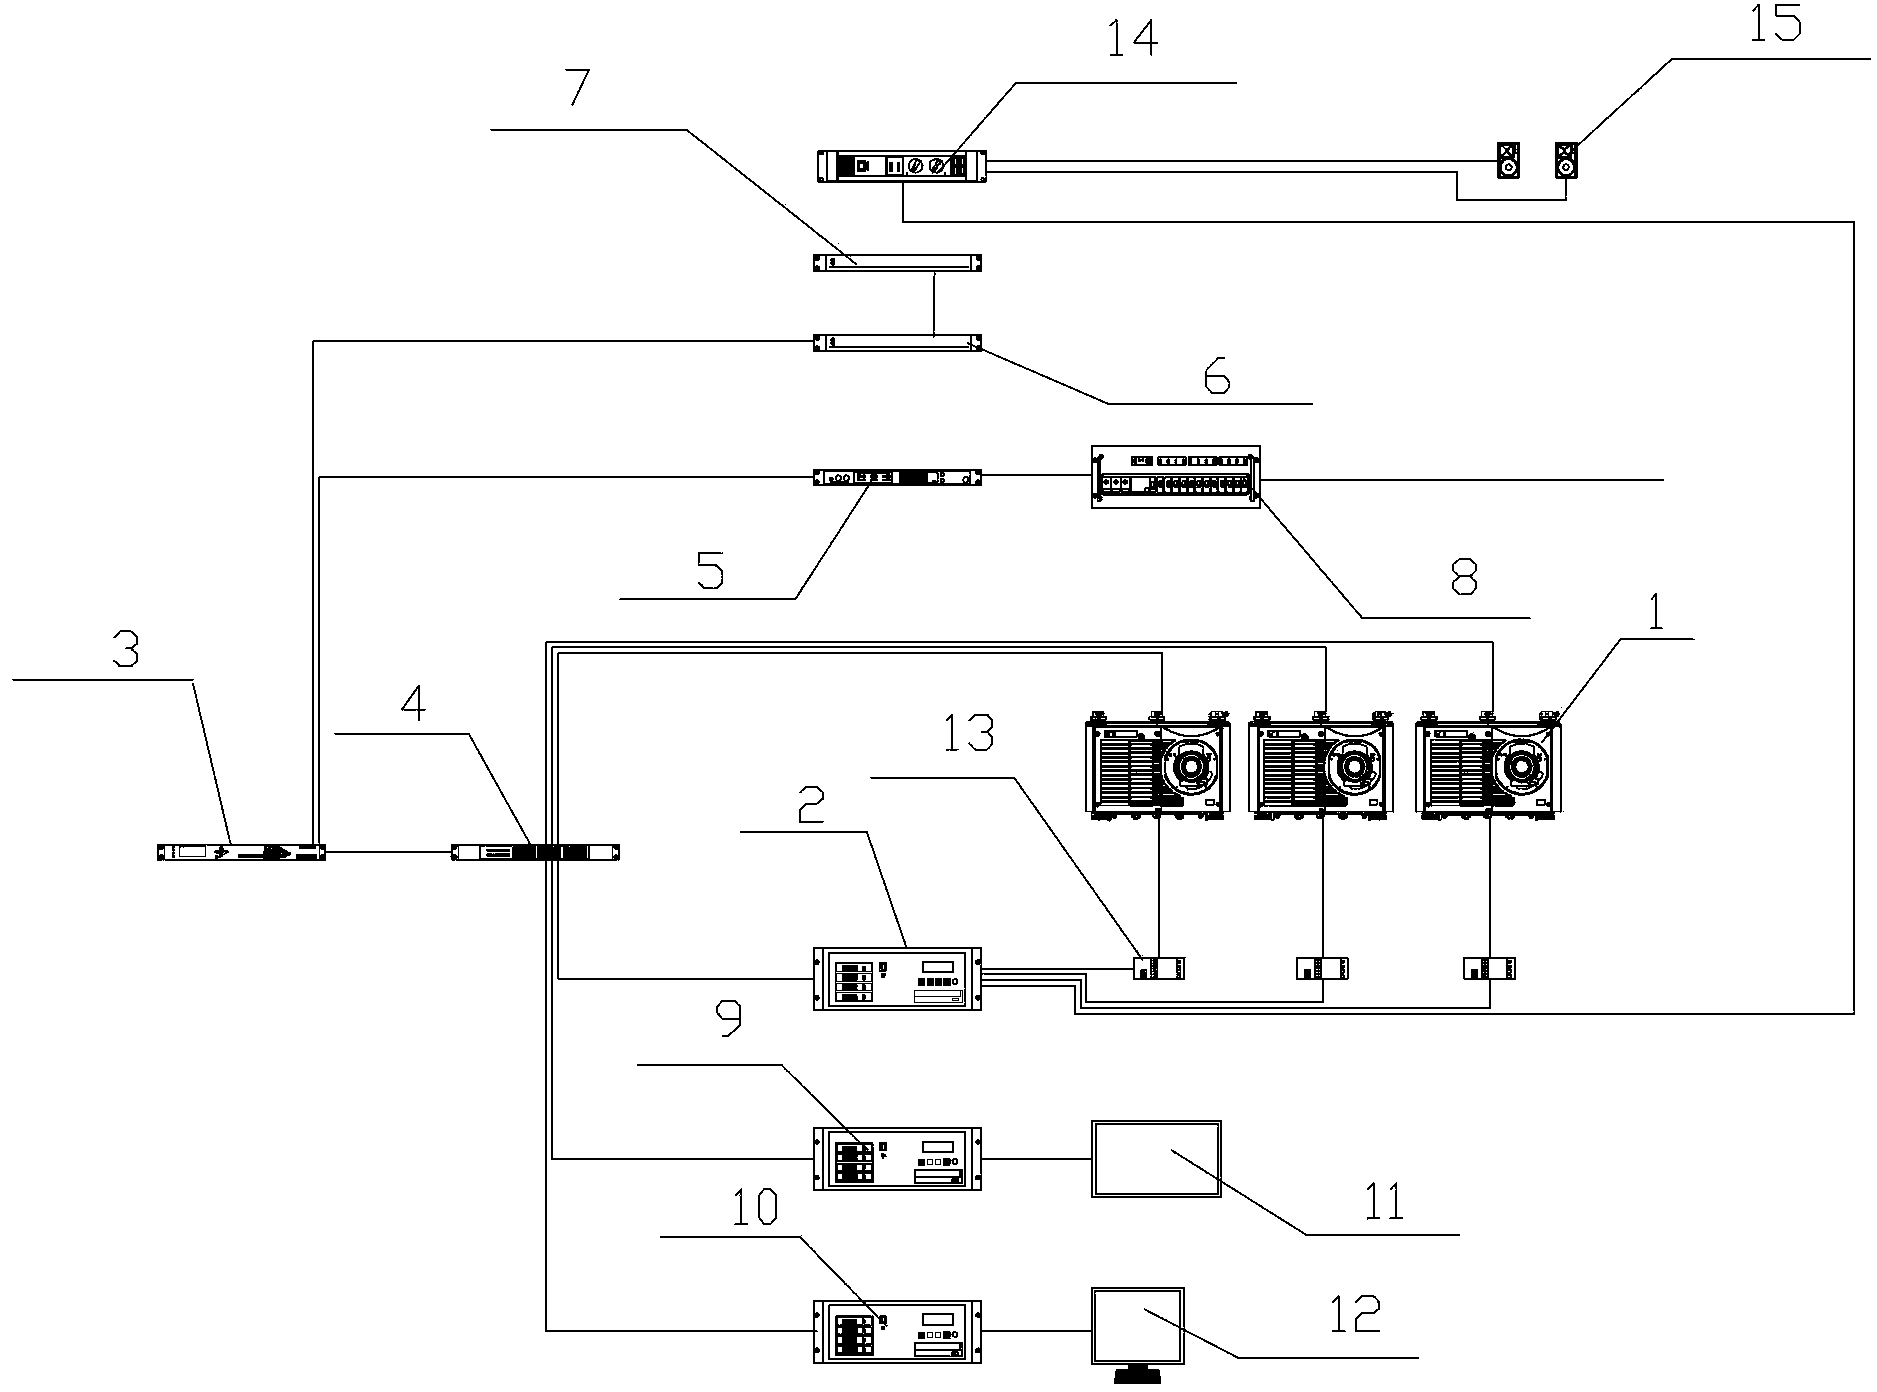
[0025] A smart grid visualization platform, including several projectors 1, a demonstration projection screen is arranged in front of the projectors 1, and a player 2 for controlling the projection images of the projectors 1, a performance controller 3, and a performance controller 3 Connected network switch 4, DMX signal distributor 5 and serial port input wizard 6, remote control controller 7, dimming silicon box 8, touch controller 9, main control machine 10, touch display 11, main control display 12, network switch 4 Connect with the player 2, touch controller 9, main controller 10 and projector 1, the DMX signal distributor 5 receives the signal command sent by the performance controller 3 to control the dimming silicon box 8 to adjust the brightness of the light, the touch control The device 9 and the main control computer 10 are respectively connected to the touch display 11 and the main control display 12 through the VGA line, the remote controller 7 is connected to the...


PUM


Abstract

Disclosed are a smart grid visualization platform and a demonstration control method. The smart grid visualization platform comprises a plurality of projectors, a player used for controlling the projectors to project images, a performance controller, a network switch, a DMX signal distributor, a serial port wizard, a remote controller, a dimmer box, a touch controller, a main control computer, a touch display and a main control display, a demonstration projection screen is arranged in front of the projectors, and the network switch, the DMX signal distributor and the serial port input wizard are connected with the performance controller. The multi-state based visualization display platform realizes interactive scene fusing visualization technologies such as interactive multimedia, dynamic smart interaction and virtual reality, shows technologies features of related links of a power grid friendly and visually, allows audiences to integrate into immersive smart grid and ecocity showing to have a strong sense of immersion, and is rich and varied in smart grid visualization display forms, high in interaction and novel and vivid in display concept.

Description

technical field [0001] The invention relates to a multimedia visualization platform and a demonstration control method, in particular to a smart grid visualization platform and a demonstration control method. Background technique [0002] The basic meaning of visualization is to use the principles and methods of computer graphics or general graphics to convert large-scale data into graphics and images, and express them in an intuitive form to help understand and analyze complex processes and characteristics. [0003] With the rapid development of information technology, display technology and virtual technology are widely used in various industries in society, but the development of three-dimensional display and virtual display technology in the power grid is lagging behind. Currently, the applications in power systems are mainly based on The two-dimensional coordinate GIS system generally uses abstract symbols such as points or lines to express electrical equipment, which c...

Claims


Application Information

Patent Timeline
Patent Type & Authority Applications(China)
IPC IPC(8): G06F3/01G06Q50/06
CPCY04S10/50
Inventor 牟兰
Owner SHANGHAI FOREMOST MULTIMEDIA
Learn More