Process reproduction visualization method based on industrial field data in web environment

An industrial site and process technology, applied in the field of information management, can solve the problems of poor cross-platform, cumbersome operation and use, and achieve the effect of good performance, easy operation, good interactive performance and visualization effect

Active Publication Date: 2017-01-11
CHONGQING UNIV
View PDF2 Cites 0 Cited by
  • Summary
  • Abstract
  • Description
  • Claims
  • Application Information

AI Technical Summary

Problems solved by technology

[0006] The purpose of the present invention is to provide a process reproduction visualization method based on industrial site data in a Web environment, which can intuitively display complex and unsightly industrial processes to specific target groups by applying multi-view models, while overcoming the traditional Under the C / S architecture, the cross-platform performance is poor, and the operation is cumbersome, etc.

Method used


Image

  • Process reproduction visualization method based on industrial field data in web environment
  • Process reproduction visualization method based on industrial field data in web environment

Examples


Embodiment Construction

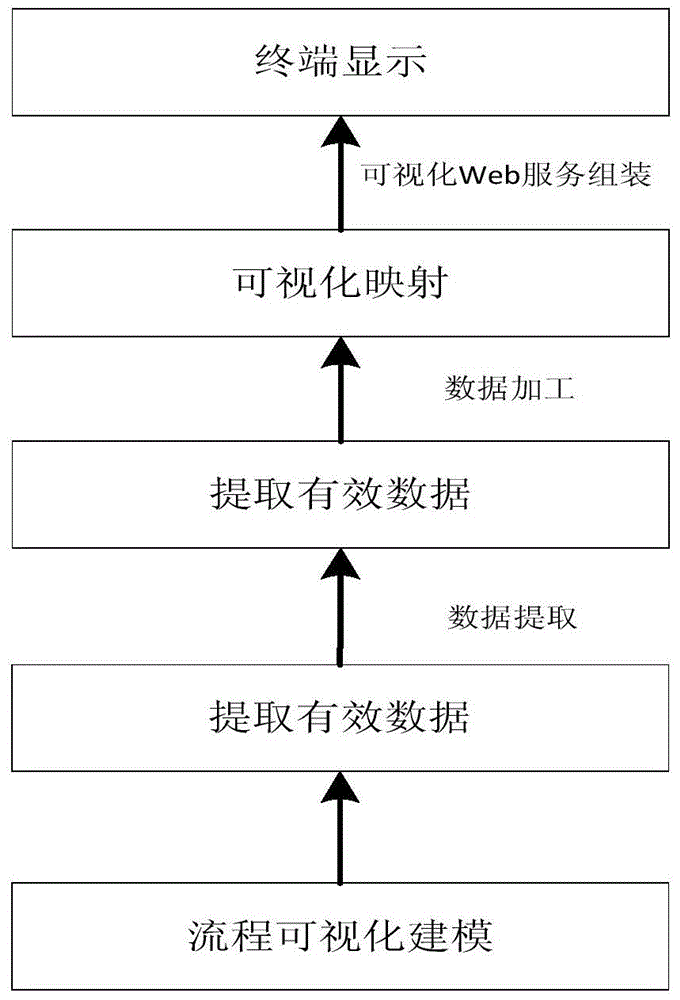
[0038] Taking liquefied natural gas, that is, liquefied natural gas, LNG, the operation process of filling the industrial site as an example, the specific implementation steps are as follows:

[0039] 1) Carry out visual modeling for the on-site operation process of LNG filling, describe the whole process of filling on-site operation with standard flowchart graphics or PAD diagrams, and use vector graphics, such as SVG format, technology to draw the flow of each process according to the actual process operation Visual operation primitives;

[0040] 2) From the original data collected at the LNG filling site, use data mining methods such as group distinction, regression analysis, association rules, feature change and deviation analysis, and refer to the prior knowledge base to extract effective data;

[0041] 3) Process the effective data extracted from the LNG filling site in 2), and output the standard data format

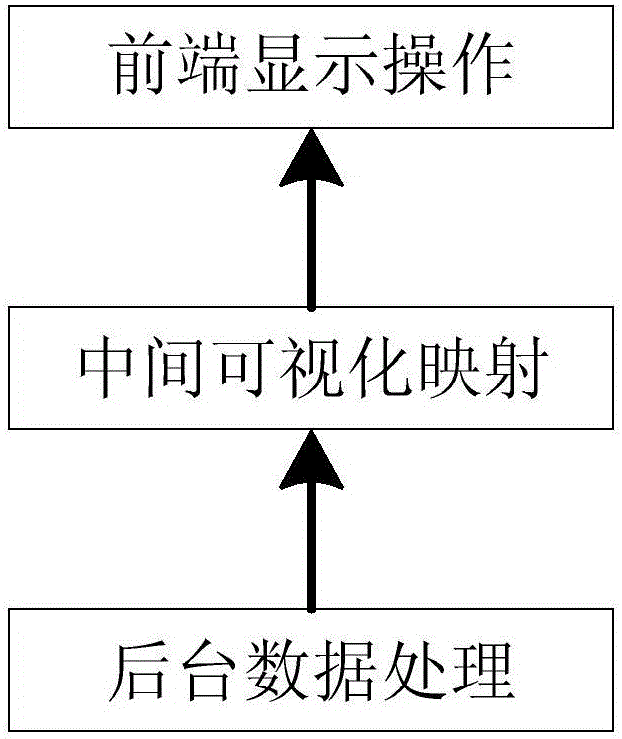
[0042] 4) To the standard data output in step 3), a visual ...


PUM


Abstract

The invention discloses a flow reappearing visualization method based on industrial field data under a Web environment. The method comprises the steps of (1) performing visual modeling on an industrial production flow; (2) extracting effective data; (3) outputting a standard data format; (4) constructing a visual mapping; and (5) performing displaying and operation at a browser end. According to the flow reappearing visualization method, a complicated and invisible industrial flow can be visually displayed to specific target people by applying a multi-view model, and the shortcomings of low cross-platform property, complicated operation use and the like of a conventional C / S architecture are overcome.

Description

technical field [0001] The invention relates to the technical field of information management, in particular to a visualization method for reproducing industrial site processes. Background technique [0002] At present, industrial production processes generally have the characteristics of multiple variables, complexity, coupling, and uncertainty. In particular, some production processes are highly dangerous and unobservable. It is particularly important to visually display the process, intuitively show it to on-site workers or train employees, and improve the safety awareness and safety precautions of industrial site operators. Most of the process visualization solutions currently used in industrial production are software tools based on C / S architecture, simulation animations and production process diagrams. To a certain extent, these three schemes have played a very good role in the visual display of industrial production processes. However, their disadvantages are also ...

Claims


Application Information

Patent Timeline
Patent Type & Authority Patents(China)
IPC IPC(8): G05B19/418
CPCY02P90/02
Inventor 张可柴毅焦春晓温大军付雪青
Owner CHONGQING UNIV
Why Eureka
Try Eureka