Weld defect ultrasound phased array sector scanned image feature extraction method
A technology of welding defects and ultrasonic phase control, which is applied in the direction of instruments, character and pattern recognition, computer components, etc., can solve problems such as long learning time, large data dimension, complex classification model, etc.
- Summary
- Abstract
- Description
- Claims
- Application Information
AI Technical Summary
Problems solved by technology
Method used
Image
Examples
specific Embodiment approach 1
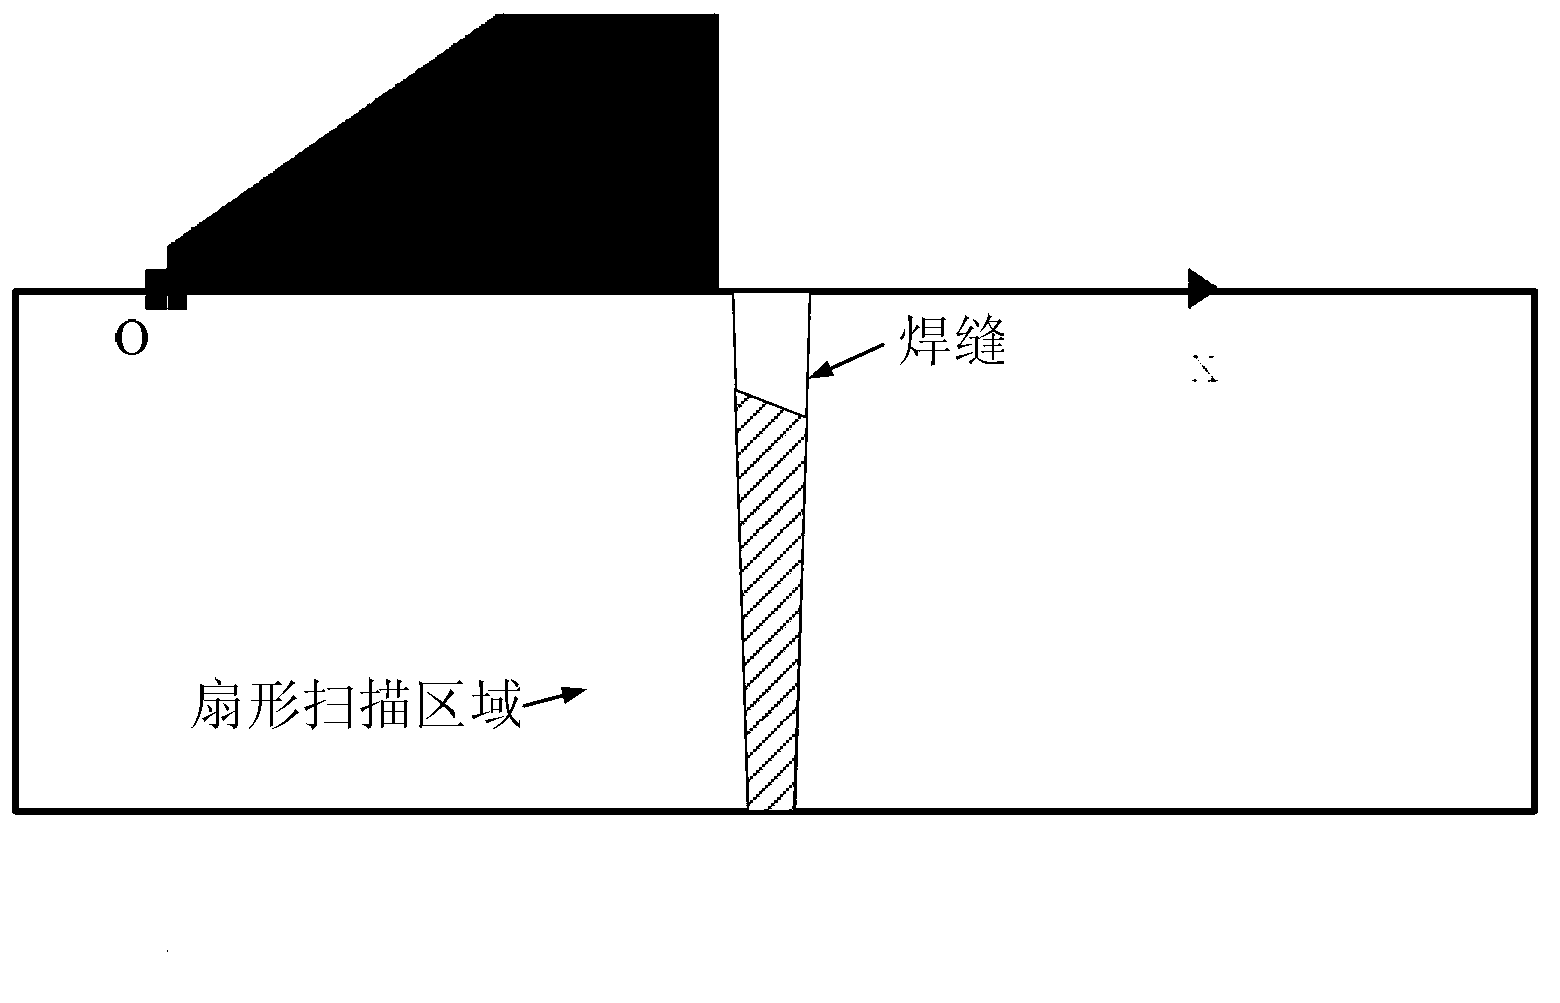
[0057] Specific implementation mode one: reference figure 2 , the ultrasonic phased array sector scanning detection is carried out on the welding sample, the initial angle of the sector scanning detection is 30°, the end angle is 70°, and the scanning step is 0.25°.
[0058] refer to image 3 , the specific process of a welding defect ultrasonic phased array sector scanning image feature extraction method described in this embodiment is as follows:
[0059] Step 1. Take n defect images, each defect image contains p data, where p=k×l×t, k is the number of ultrasonic A signals in each defect image, l is the data contained in each ultrasonic A signal, t is the echo amplitude and defect three-dimensional coordinate information contained in the data, so a total of n×p data are obtained, and the defect image data matrix X is as follows:
[0060] X = x 11 ...
Embodiment
[0076] Embodiment: the feature extraction process of welding defect sector scan image is as follows:
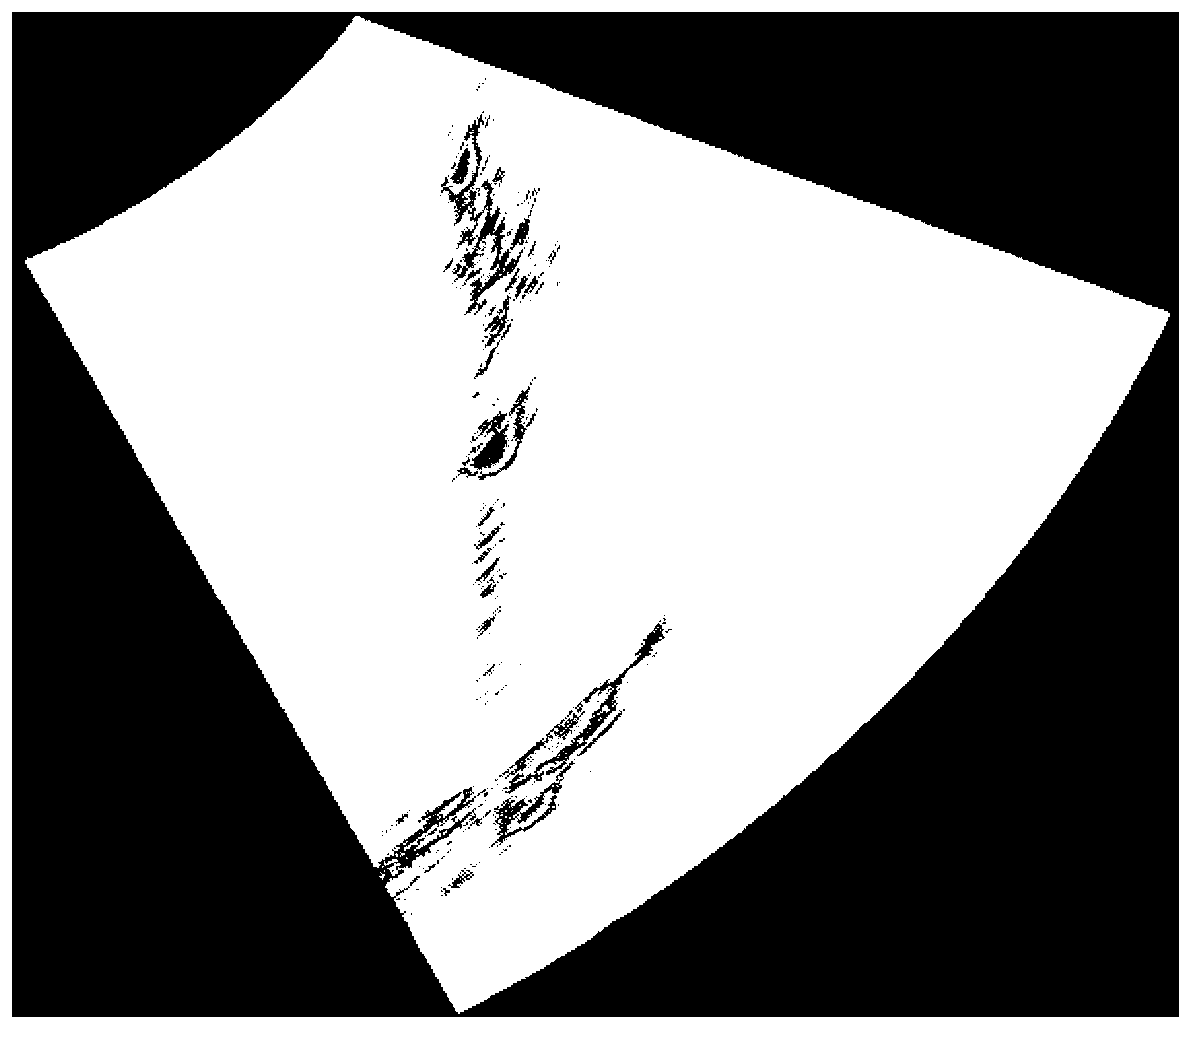
[0077] 200 images were selected from the ultrasonic phased array sector scan images of pores, cracks, incomplete fusion and incomplete penetration defects, and a total of 800 images of the four defects. Each defect image contains 161 beams of ultrasonic A signals, and each beam of ultrasonic A signals contains 1520 points of data, and each point of data contains four pieces of information, including defect echo amplitude and three-dimensional coordinates, so that the amount of data contained in each defect image is 978880, the data matrix X of 800 defect images is as follows:
[0078]
[0079] The covariance matrix Σ of the calculated defect image data matrix is:
[0080]
[0081] Then get the eigenvalue λ of the covariance matrix Σ, and arrange it from large to small as:
[0082] λ = [31.1, 4.5, ..., 0.00001]
[0083] The calculated orthonormal eigenvector correspondi...
PUM
 Abstract
Description
Claims
Application Information
 - R&D Engineer
- R&D Manager
- IP Professional
- Industry Leading Data Capabilities
- Powerful AI technology
- Patent DNA Extraction
Browse by: Latest US Patents, China's latest patents, Technical Efficacy Thesaurus, Application Domain, Technology Topic, Popular Technical Reports.
© 2024 PatSnap. All rights reserved.Legal|Privacy policy|Modern Slavery Act Transparency Statement|Sitemap|About US| Contact US: help@patsnap.com


