Method for discriminating reservoir fluid by establishing gas logging chart on basis of discriminant analysis
A technique of discriminant analysis and gas survey chart, applied in the direction of earthwork drilling and production, wellbore/well components, etc., can solve problems such as difficult to effectively distinguish reservoir fluids, and achieve accurate discrimination and accurate judgment
- Summary
- Abstract
- Description
- Claims
- Application Information
AI Technical Summary
Problems solved by technology
Method used
Image
Examples
Embodiment 1
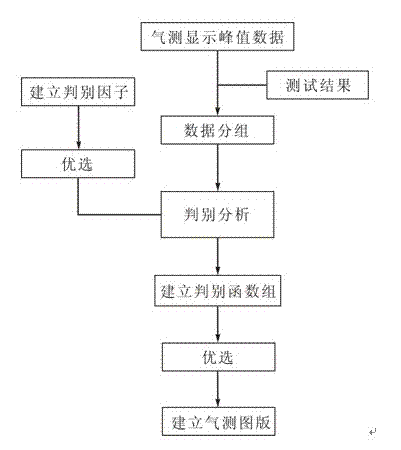
[0033] The invention discloses a method for judging reservoir fluid by using discriminant analysis to establish a gas survey chart, which is characterized in that it includes the following steps:
[0034] a. Collect gas testing peak data and oil testing results of wells after oil testing;
[0035] b. According to the category of the obtained oil testing results, group the gas testing peak data of each mud logging display segment with the same oil testing result category;
[0036] c. Establish a discriminant factor based on the gas logging peak data of the well section shown in mud logging;
[0037] d. Select the established discriminant factor, and establish a discriminant function that can effectively distinguish fluid properties according to discriminant analysis;
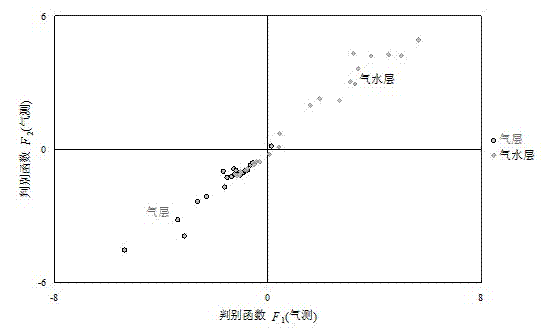
[0038] e. According to the coincidence rate of each established discriminant function, two of the discriminant functions with the highest coincidence rate are selected as the x and y axes respectively to establi...
Embodiment approach
[0040] Refer to the attached figure 1 and 2 , the best implementation mode of the present invention is as follows:
[0041] 1. Combining the gas logging peak data of wells in the same block after oil testing, they are divided into different groups according to their different oil testing results.
[0042] According to the different oil test results, they are divided into different groups: according to the category of the corresponding oil test results displayed by each gas test (such as: gas layer, water layer, gas-water layer, etc.), each display peak data Carry out grouping, taking gas-water discrimination as an example, group the peak data of the gas test display corresponding to the gas layer as the result of the oil test into one group, and group the peak data of the gas test display corresponding to the same layer of gas and water as the result of the oil test into two groups, and so on.
[0043] 2. Establish discriminant factors based on the gas measurement values ...
Embodiment 3
[0057] Following is the specific application process of the present invention:
[0058] 1. Collect the peak value data and oil testing result data of wells in the same block after oil testing.
[0059] 2. According to the oil test results, group the peak data of each mud logging display with the same oil test result category.
[0060] 3. Optimizing the discriminant factor that can more effectively reflect the properties of the reservoir fluid.
[0061] 4. Using discriminant analysis to establish multiple discriminant functions that can effectively distinguish fluid properties .
[0062] 5. According to the coincidence rate of each discriminant function established, two of the discriminant functions with the highest coincidence rate are selected as the x and y axes respectively to establish the gas survey chart.
[0063] In practice, in order to establish a gas survey chart with a higher coincidence rate, it may be necessary to select discriminant factors multiple times, es...
PUM
 Abstract
Description
Claims
Application Information
 - R&D
- Intellectual Property
- Life Sciences
- Materials
- Tech Scout
- Unparalleled Data Quality
- Higher Quality Content
- 60% Fewer Hallucinations
Browse by: Latest US Patents, China's latest patents, Technical Efficacy Thesaurus, Application Domain, Technology Topic, Popular Technical Reports.
© 2025 PatSnap. All rights reserved.Legal|Privacy policy|Modern Slavery Act Transparency Statement|Sitemap|About US| Contact US: help@patsnap.com


