Time-varying non-stable-signal time-frequency analyzing method

A non-stationary signal, time-frequency analysis technology, applied in spectrum analysis/Fourier analysis, etc., can solve problems such as low-energy components, lack of theoretical basis for definitions, and unreasonable spectrum characteristics

Active Publication Date: 2012-08-29
CMCU ENG
View PDF2 Cites 25 Cited by
  • Summary
  • Abstract
  • Description
  • Claims
  • Application Information

AI Technical Summary

Problems solved by technology

The instantaneous frequency calculated by this method has high time resolution and high frequency resolution. However, there are three main disadvantages here: unreasonable spectral features will be genera...

Method used


Image

  • Time-varying non-stable-signal time-frequency analyzing method
  • Time-varying non-stable-signal time-frequency analyzing method
  • Time-varying non-stable-signal time-frequency analyzing method

Examples


Embodiment

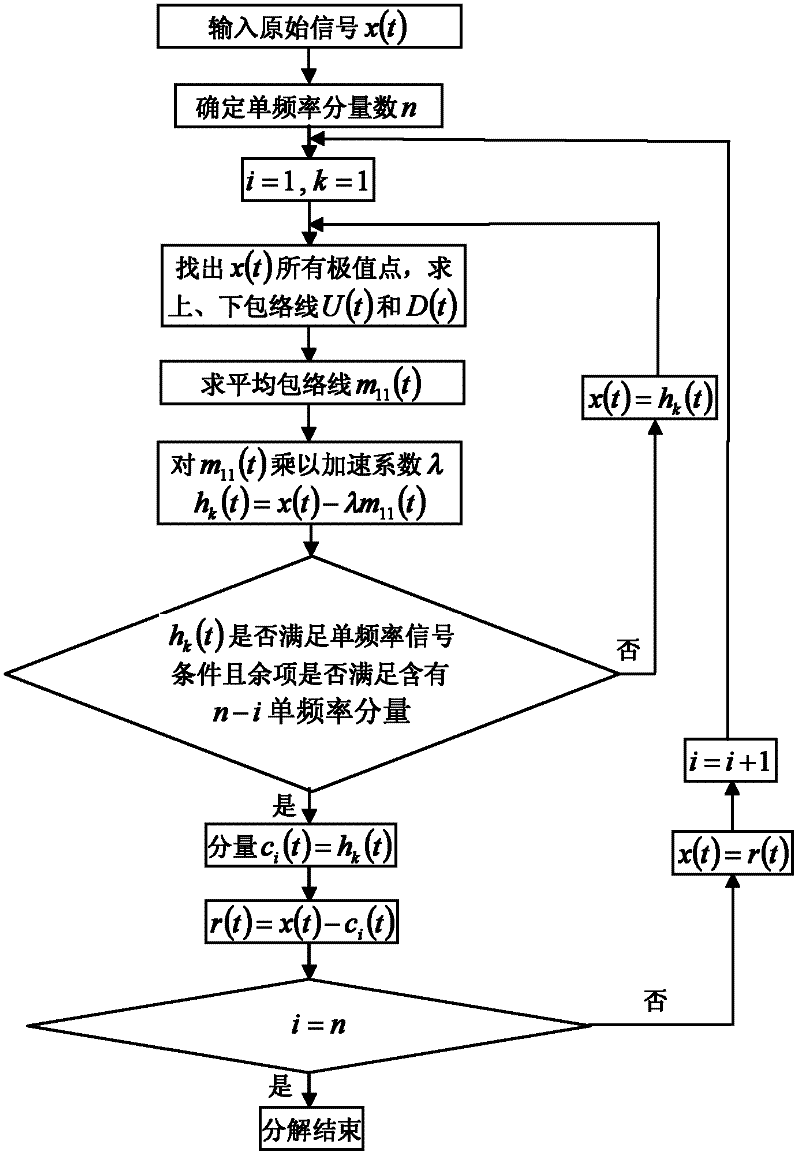
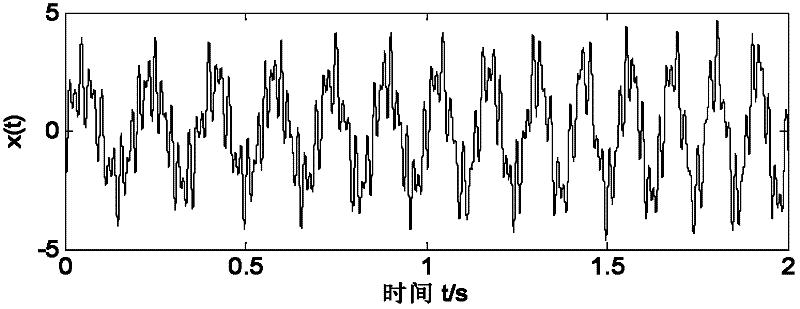
[0154] Consider the signal shown in equation (28):

[0155] x(t)=2cos(20πt)cos[100πt+2cos(6πt)]+2e 0.2t sin(10πt+2πt 2 ) (28)

[0156] The sampling frequency is 1000Hz, and the sampling time is 0-2s. The time domain waveform is as follows: image 3 shown.

[0157] Equation (28) can be changed to

[0158] x(t)=cos[120πt+2cos(6πt)]+cos[80πt+2cos(6πt)]+2e 0.2t sin(10πt+2πt 2 ) (29)

[0159] Adopt method of the present invention to carry out single-frequency signal decomposition to it, decompose and obtain c1, c2, c3 components and trend item r(t), such as Figure 4 shown. Depend on Figure 4 It can be seen that the three components correspond to the three components of the simulated signal x(t), therefore, the method of the present invention is based on the self-adaptive decomposition of the signal itself, and each component obtained has a certain physical meaning, reflecting the intrinsic nature of the signal. In the amplitude-frequency-time three-dimensional space, i...


PUM


Abstract

The invention discloses a time-varying non-stable-signal time-frequency analyzing method. The method comprises the steps of providing definitions of single-frequency signals and i(th)-level local extremum, conducting single-frequency signal decomposition on the time-varying non-stable signals according to the definitions so as to obtain a plurality of single-frequency components, then obtaining a plurality of instantaneous frequency and instantaneous amplitude of the components by Hilbert, further, drawing the amplitude on a time-frequency plane in an amplitude-frequency-time three-dimensional space to obtain a Hilbert amplitude spectrum, and conducting integration on the time through the amplitude spectrum to obtain a Hilbert marginal spectrum. According to the method, the complete adaptability is realized; meanwhile, the method is not restricted by uncertainty principle, and the time and the frequency have high resolution ratio; the decomposition is thorough, so that the respectively independent single-frequency components, namely the substantive characteristics, are obtained, and cross terms among all the components do not exist; and the calculating time is saved as the accelerating method is adopted in the decomposition process.

Description

technical field [0001] The invention relates to a method for time-frequency analysis of time-varying non-stationary signals. Background technique [0002] The classic Fourier transform theory establishes a bridge for transforming signals from the time domain to the frequency domain. However, the Fourier transform cannot describe the change of frequency with time. That is to say, the Fourier transform cannot describe the time-frequency local characteristics of the signal, and is only suitable for analyzing stationary signals but not for non-stationary signals with time-varying characteristics. [0003] In order to make up for the deficiency of the Fourier transform, it is necessary to find a new method that can implement time-frequency localization on the signal to process the signal, which leads to the method of directly characterizing the signal on the time-frequency plane, that is, the frequency analysis method. At present, the time-frequency analysis method that is wide...

Claims


Application Information

Patent Timeline
IPC IPC(8): G01R23/16
Inventor 宋斌华唐毅毛伟文灵红
Owner CMCU ENG
Why Eureka
Try Eureka