
Graph processing device and method

A graphics processing and graphics conversion technology, applied in the direction of drawing from basic elements, can solve problems such as unfavorable overall analysis and judgment, unfavorable observation, and inability to express in a chart

Inactive Publication Date: 2010-09-22
INST OF GEOGRAPHICAL SCI & NATURAL RESOURCE RES CAS
View PDF5 Cites 5 Cited by
  • Summary
  • Abstract
  • Description
  • Claims
  • Application Information

AI Technical Summary

Problems solved by technology

However, in this way, time, space and parameter data cannot be expressed in a chart, which is not conducive to overall analysis and judgment
Although time, space and parameter data can be expressed in a three-dimensional chart at the same time, there are still problems that are not conducive to observation and not intuitive enough

Method used

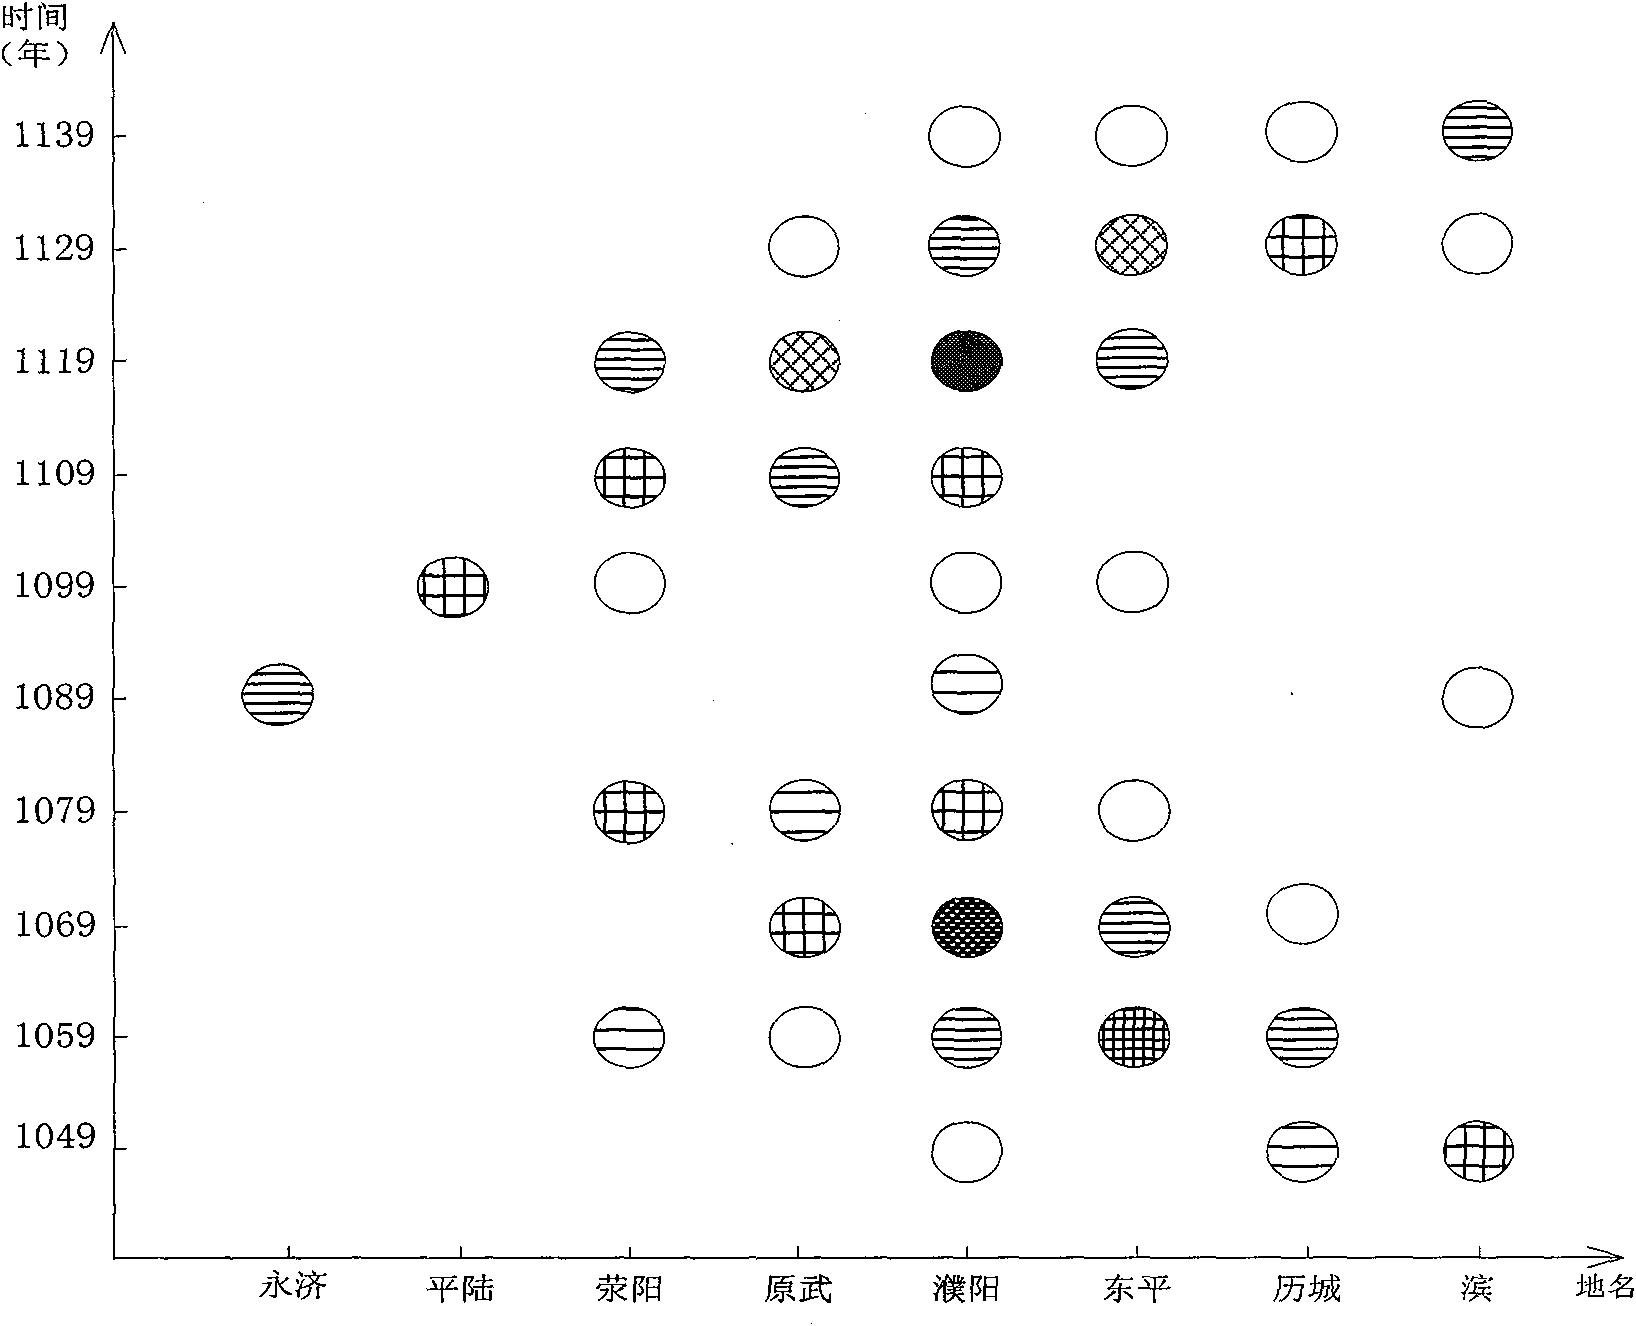
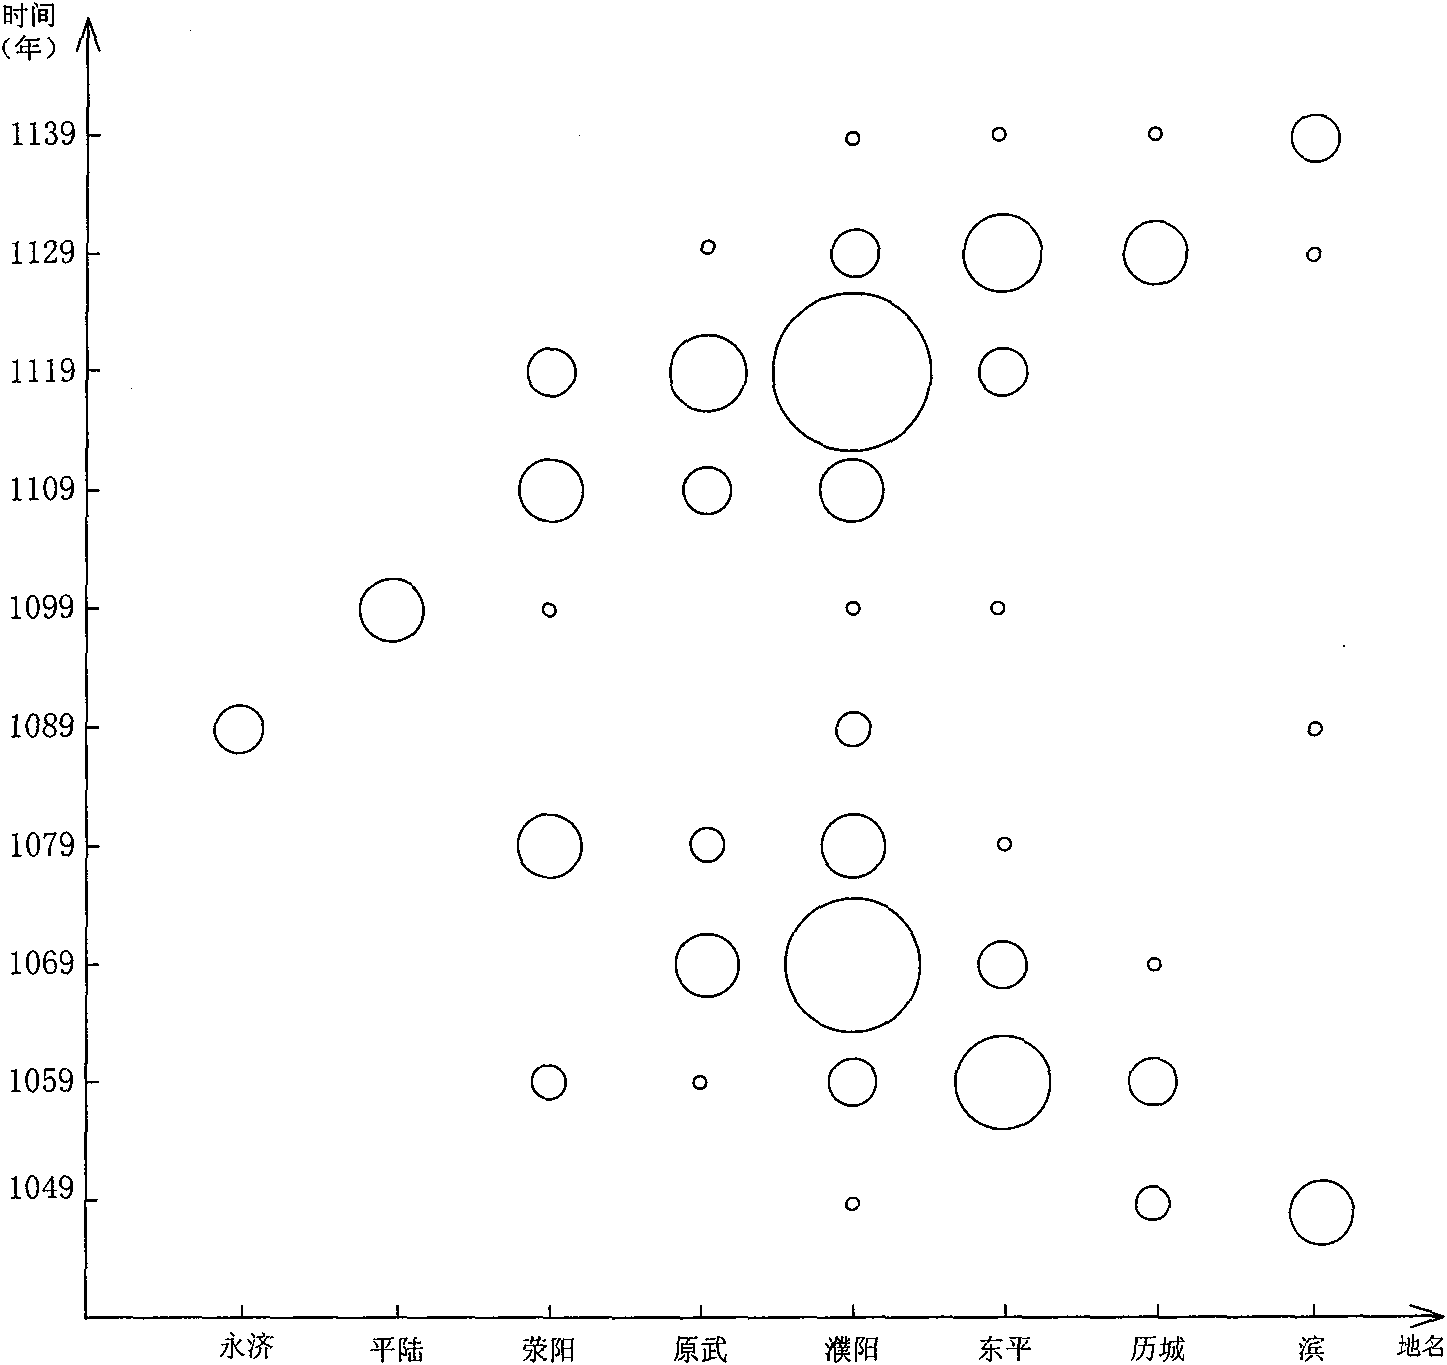
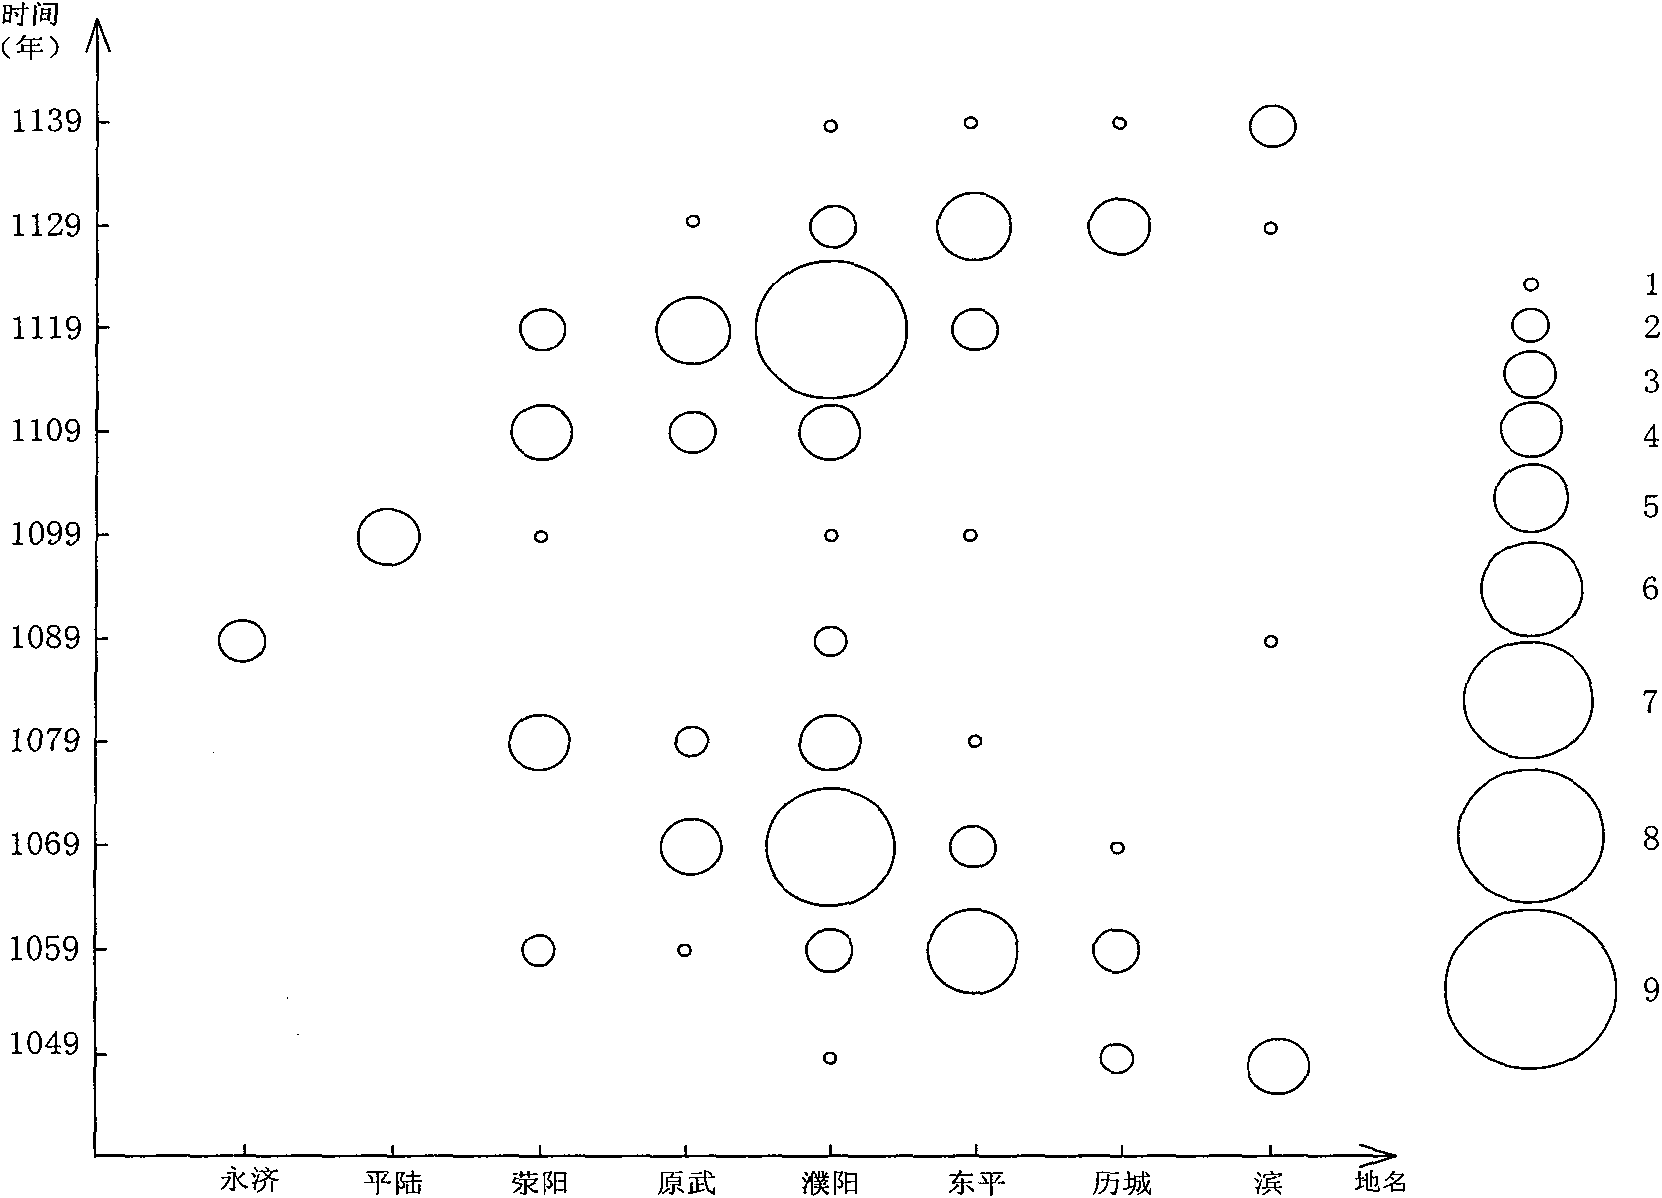

Image

  • Graph processing device and method
  • Graph processing device and method
  • Graph processing device and method

Examples


Embodiment Construction

[0036] The implementation process of the present invention is described below in conjunction with specific embodiments, so that those skilled in the art can implement the technical solution of the present invention.

[0037] See figure 1 Shown is a schematic structural diagram of a graphics processing device 100 of the present invention. The device 100 includes a data acquisition unit 110 , a symbol setting unit 120 , and a graphic conversion unit 130 .

[0038] The data acquiring unit 110 is configured to acquire three-axis coordinate information of a three-dimensional chart, the three axes including a first axis, a second axis, and a third axis;

[0039] A symbol setting unit 120, the symbol setting unit 120 is used to set at least one map symbol, the map symbol is used to represent a kind of parameter information, the parameter information is the information represented by the third axis in the three-dimensional graph, different The map symbols of represent different thir...


PUM


Abstract

The invention discloses a graph processing device and a graph processing method. The device comprises a data acquisition part, a symbol setting part and a graph conversion part, wherein the data acquisition part is used for acquiring three-axis coordinate information of a three-dimensional graph; the symbol setting part is used for setting at least one map symbol, the map symbol is used for expressing information expressed by a third axis in the three-dimensional graph, and different map symbols express different third-axis coordinate information; and the graph conversion part is used for generating a two-dimensional graph according to the three-axis coordinate information acquired by the data acquisition part, the information expressed by the first axis of the two-dimensional graph is consistent with the information expressed by the first axis of the three-dimensional graph, the information expressed by the second axis of the two-dimensional graph is consistent with the information expressed by the second axis of the three-dimensional graph, the corresponding position of the graph conversion part on the two-dimensional graph is determined by using first and second-axis coordinate information of the three-axis coordinate information, and a map symbol corresponding to the third-axis coordinate information in the three-dimensional graph is set at the position.

Description

technical field [0001] The invention relates to a graphics processing field, in particular to a device and method for automatically converting a three-dimensional graph into a two-dimensional graph. Background technique [0002] Statistical related data is one of the most effective means to analyze things. A large amount of related data is summarized and classified to form a statistical chart to understand the status of things. [0003] The statistical graph, also known as a statistical graph or a trend graph, is a graph used to present the development trend of something or a certain information data. There are many types of statistical charts, among which the more common one is the spatio-temporal statistical chart, and the spatio-temporal statistical chart is a chart used to present the information quantity and development trend of a certain thing or information in time and space. Spatio-temporal statistics are widely used in various aspects, such as the analysis and expr...

Claims


Application Information

Patent Timeline
Patent Type & Authority Applications(China)
IPC IPC(8): G06T11/20
Inventor 王英杰余卓渊李洪省罗斌苏艳军
Owner INST OF GEOGRAPHICAL SCI & NATURAL RESOURCE RES CAS
Learn More