
Determining thin film stack functional relationships for measurement of chemical composition

a thin film stack and functional relationship technology, applied in the field of integrated circuits, can solve the problems of difficult determination of the chemical composition of these layers, and achieve the effects of improving performance, poor correlation, and improving correlation

Active Publication Date: 2013-10-01
KLA CORP
View PDF5 Cites 0 Cited by
  • Summary
  • Abstract
  • Description
  • Claims
  • Application Information

AI Technical Summary

Benefits of technology

This method provides a more flexible and accurate correlation between optical properties and chemical composition, enabling the estimation of complex chemical compositions in thin film stacks using easily measurable optical properties, improving the determination of chemical composition in integrated circuits.

Problems solved by technology

However, the chemical composition of these layers is often relatively difficult to determine, especially on production integrated circuits, and more especially in a non-destructive and relatively speedy manner.

Method used


Image

  • Determining thin film stack functional relationships for measurement of chemical composition
  • Determining thin film stack functional relationships for measurement of chemical composition
  • Determining thin film stack functional relationships for measurement of chemical composition

Examples


example

[0035]An example of the step of constructing the optical state function is provided below, in reference to Table 1.

[0036]

TABLE 1Optical state value matrix for nitrogen (N) fractionfor a two-layer model of HfSiON over an underlyingSiON layer (over silicon substrate).Nnormalized n(wavelength)XPSn′(160 nm)n′(180 nm)n′(320 nm)n′(633 nm)N offsett / t avg0.1631.254851.331021.313421.232780.089950.967940.1481.195461.250451.192471.126690.088500.996830.1711.298701.375481.382321.296590.086201.044500.1751.146951.203201.208771.136490.097320.834780.1711.093231.126131.097631.038820.097200.836750.1241.094801.180081.101991.033500.105910.702840.1661.393281.476741.473361.382290.077941.239100.1511.321361.394161.316861.242670.077671.246060.0951.411471.536021.405561.316000.081691.14581

[0037]The optical state function that is regressed from this optical state data is: Nitrogen fraction=0.010*n′(160 nm)-0.607n′(180 nm)+0.464n′ (320 nm)-0.640*N offset+0.058*T / Tavg+0.347

[0038]“N XPS”=fraction of nitrogen measu...


PUM

PropertyMeasurementUnit
chemical compositionaaaaaaaaaa
optical propertiesaaaaaaaaaa
optical state functionaaaaaaaaaa

Abstract

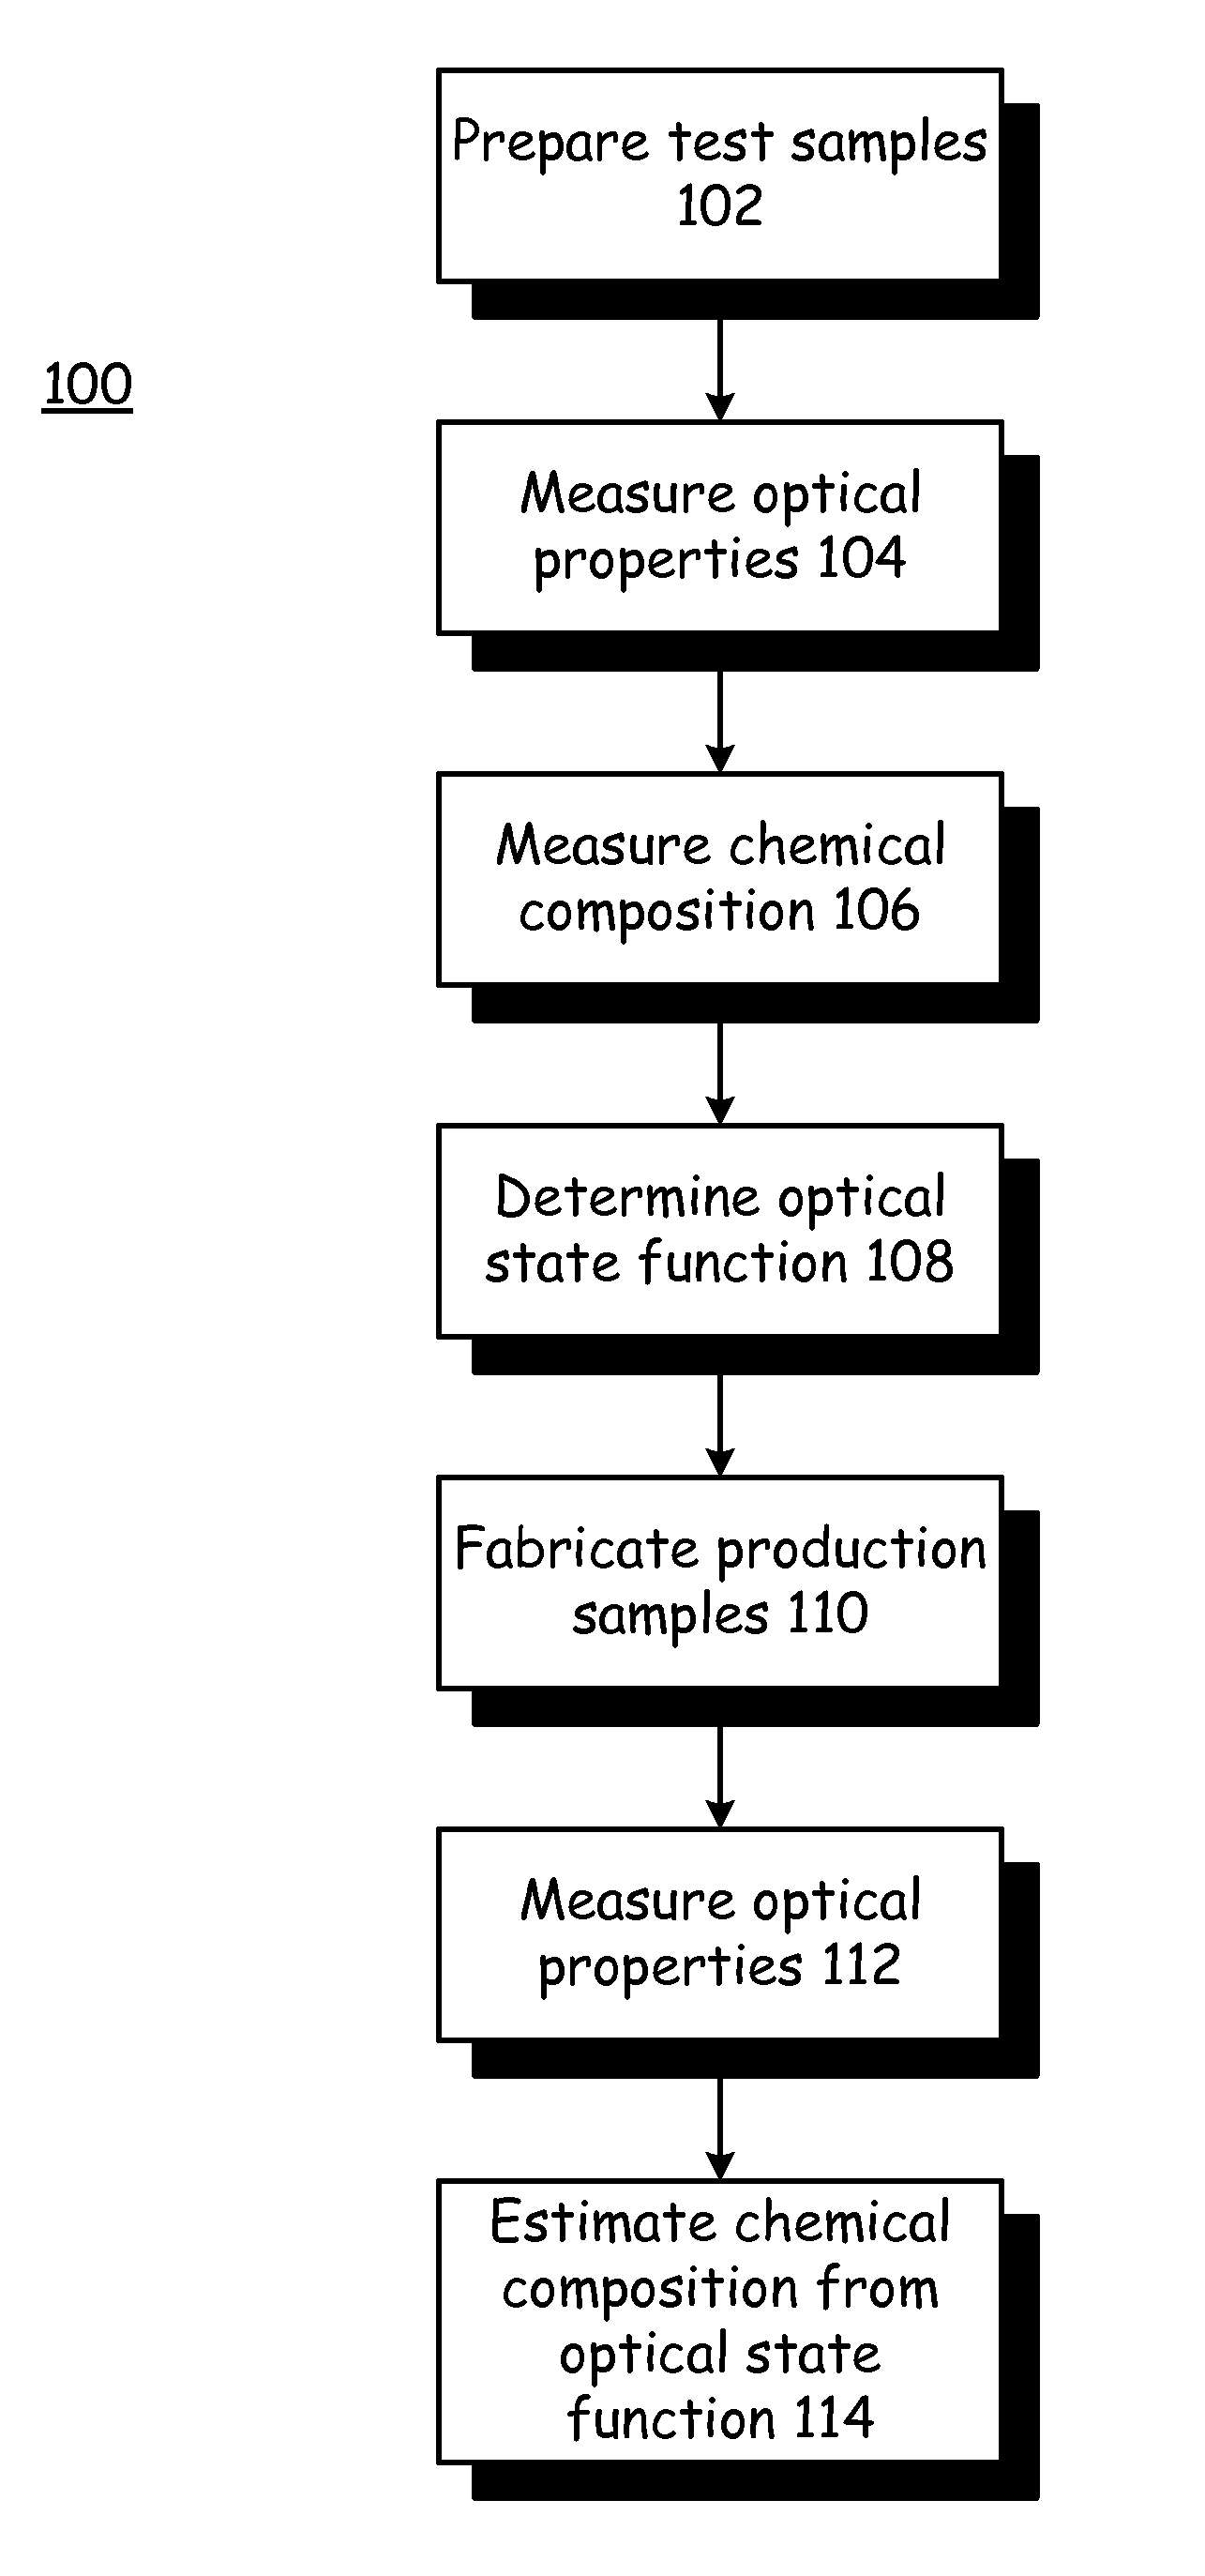
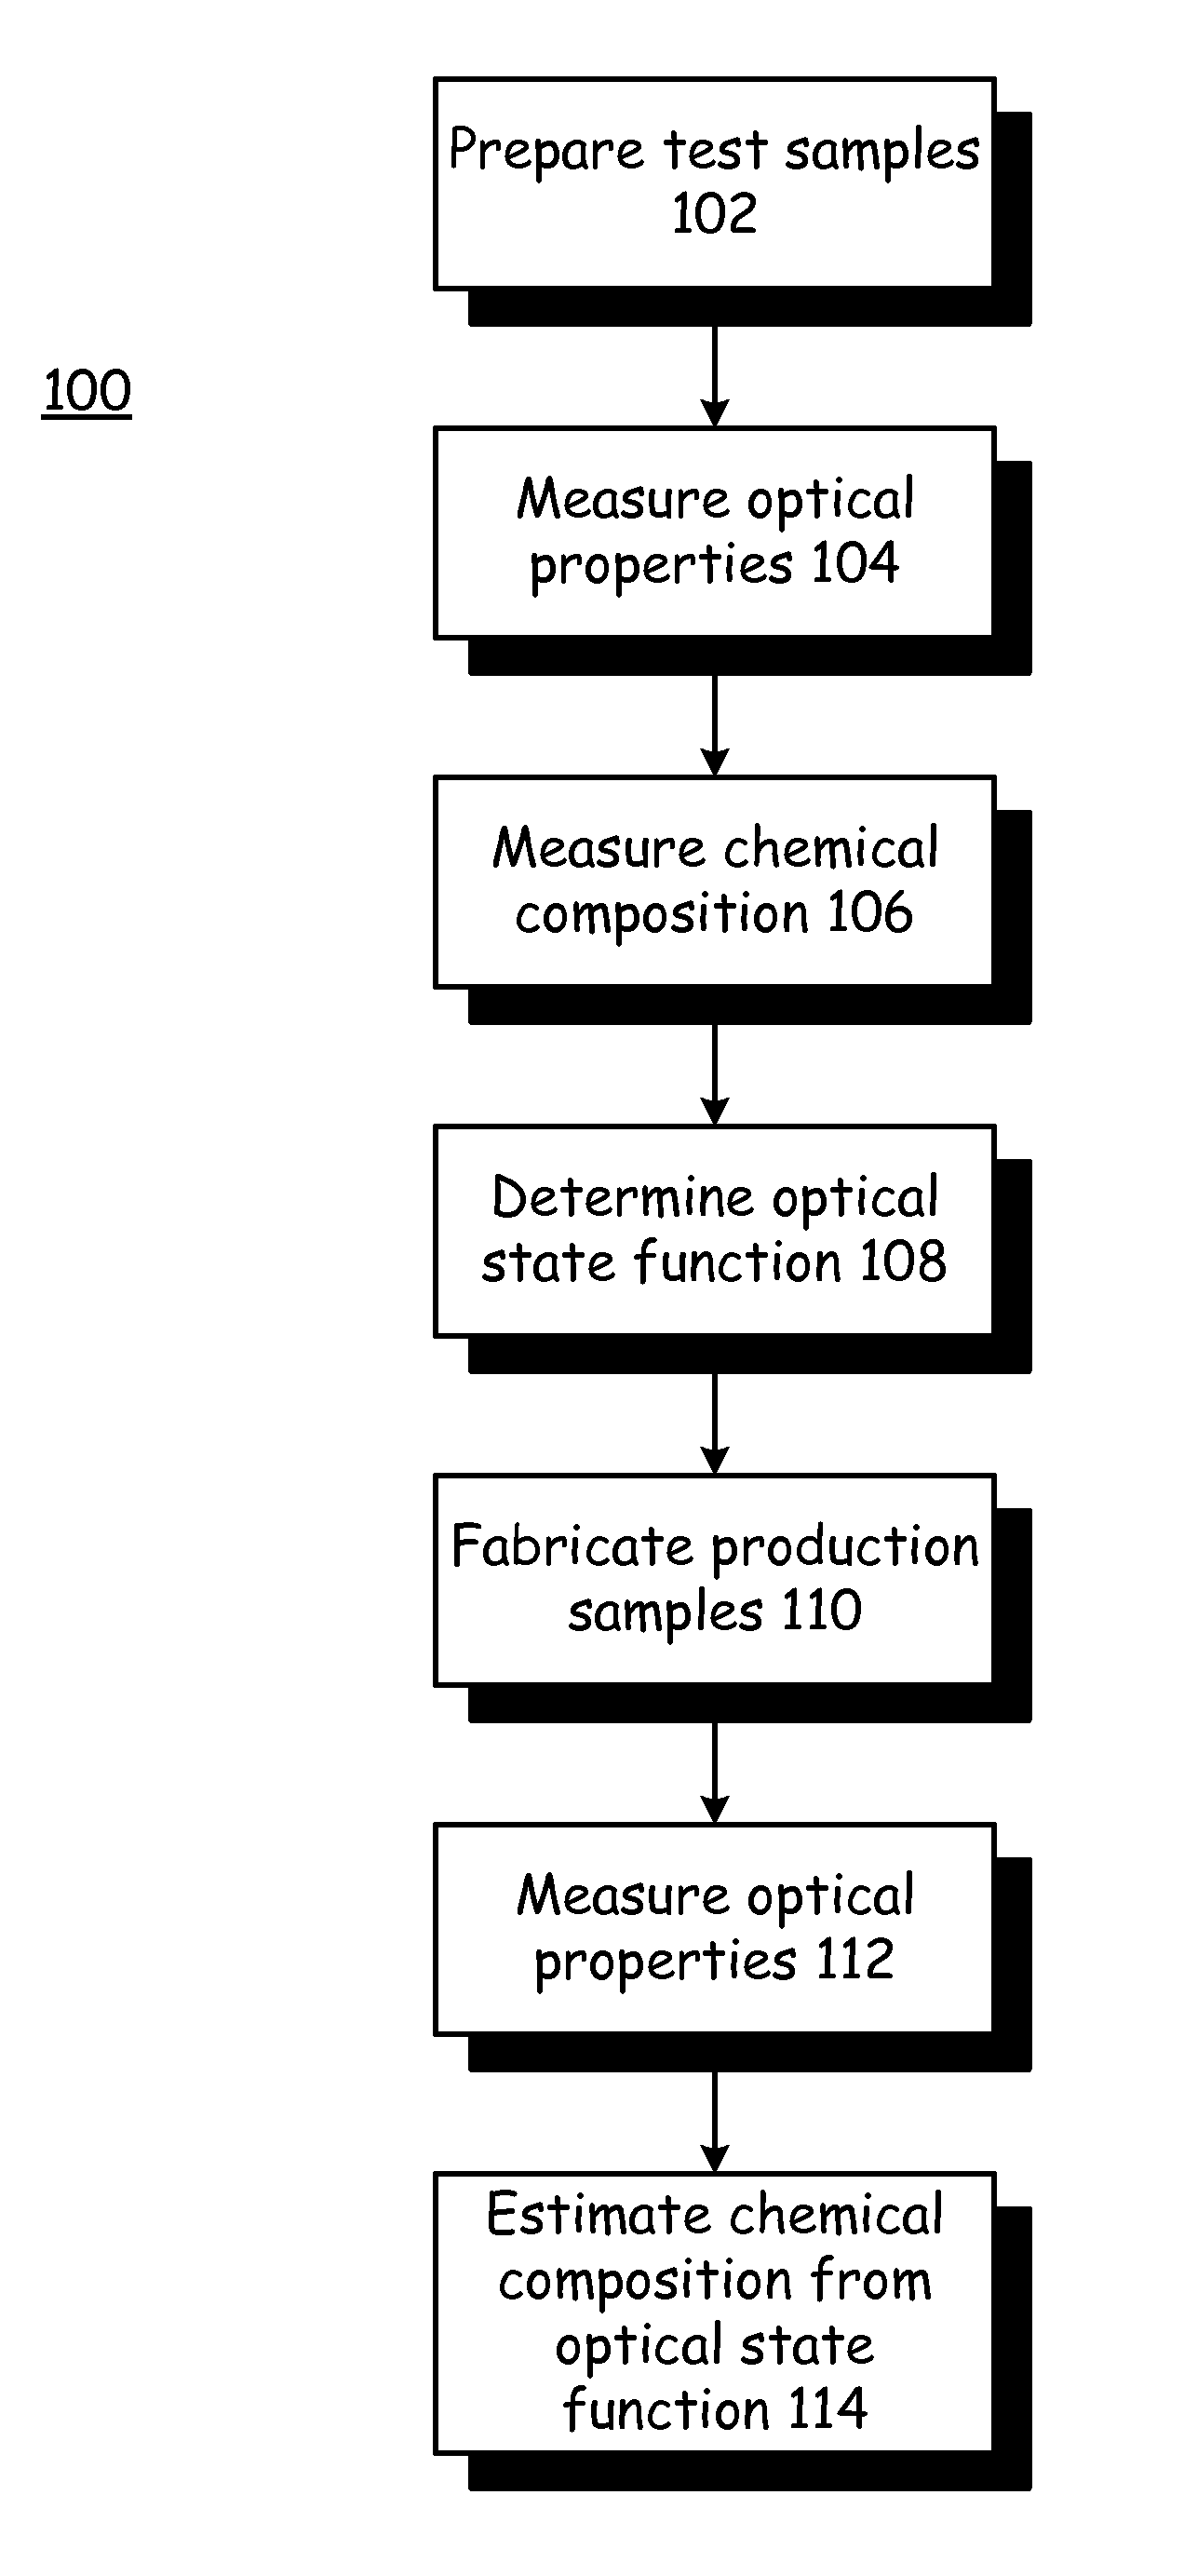
A method for determining chemical composition from optical properties of a stack formed with a process, by preparing test samples of the stack using known and intentional variations to the process to affect a variation in the chemical composition, measuring the optical properties of the test samples, measuring the chemical composition of the test samples, performing a processor-based regression analysis to determine an optical state function including correlations between the optical properties of the test samples and the chemical composition of the test samples, fabricating production samples of the stack using the process, measuring the optical properties of the production samples, and estimating the chemical composition of the production samples using the optical state function.

Description

FIELD[0001]This invention relates to the field of integrated circuits. More particularly, this invention relates to using the optical properties of thin film stacks to estimate the chemical composition of thin film stacks.INTRODUCTION[0002]In very general terms, integrated circuits are fabricated by forming a thin film layer of a given material on a substrate, patterning or otherwise processing the layer, and then repeating that cycle for a number of additional layers and different materials. As the term is used herein, “integrated circuit” includes devices such as those formed on monolithic semiconducting substrates, such as those formed of group IV materials like silicon or germanium, or group III-V compounds like gallium arsenide, or mixtures of such materials. The term includes all types of devices formed, such as memory and logic, and all designs of such devices, such as MOS and bipolar. The term also comprehends applications such as flat panel displays, solar cells, and charge...

Claims


Application Information

Patent Timeline
Patent Type & Authority Patents(United States)
IPC IPC(8): G01N31/00
CPCG01N21/211G01N2021/213
Inventor YGARTUA, CARLOS L.
Owner KLA CORP
Learn More