Fibrinogen alpha and hemoglobin polypeptides as cancer markers
a technology of fibrinogen alpha and hemoglobin, which is applied in the direction of peptides, material analysis using wave/particle radiation, liquid/fluent solid measurements, etc., can solve the problems of unfavorable early detection, unfavorable early detection, and at least 10% of breast cancer cannot be visualized with mammography
- Summary
- Abstract
- Description
- Claims
- Application Information
AI Technical Summary
Benefits of technology
Problems solved by technology
Method used
Image
Examples
example 1
General Methods
[0069]Patient Cohort and Sample Handling
[0070]Sixty-one pre-therapy patients with HER2-positive breast cancer and 61 healthy women controls were used for the study. For the case-control study, plasma from the patients was randomly split into a training set of 40 patients and 40 controls and a test set of 21 patients and 21 controls. The cancer and control samples were collected in the same way to avoid possible systemic bias. For the longitudinal study, plasma from another cohort of 28 patients with operable cancer underwent a pre-treatment plasma collection and were compared to plasma from a blood draw at least two-weeks after the completion of all treatments (post-treatment blood draw). These women were treated on neo-adjuvant protocols in which trastuzumab (herceptin) combined with chemotherapy was given prior to surgery. All stage II and III women underwent surgery, either mastectomy or wide excision (lumpectomy), and a combination of procedures were done on ipsil...
example 2
Biomarker Selection (Case-Control Study)
[0084]Table 1 shows the clinical characteristics of patients in the case-control study. The distribution of disease burden (stage) and hormone receptor content in primary tumors was similar in cases assigned to the learning and test sets. All tumors were HER2-positive by usual clinical criteria, and all tumors were high-grade breast cancers. Sixty-one breast cancer patients and controls were randomly partitioned into a training set containing 40 patients and 40 controls, and a test data set containing 21 patients and 21 controls. A total of 57 peaks passed selection criteria. Using cross validation and variable feature selection, R-SVM selected a seven biomarker set that was the optimal predictor of cancer status (FIG. 1, Supplemental Data). We then compared the biomarkers discovered by R-SVM to those found by Random Forest algorithm, t-test, and receiver operation curve algorithms. The results are summarized in Table 2. The seven-biomarkers s...
example 3
Identification of a 2660 Dalton Marker
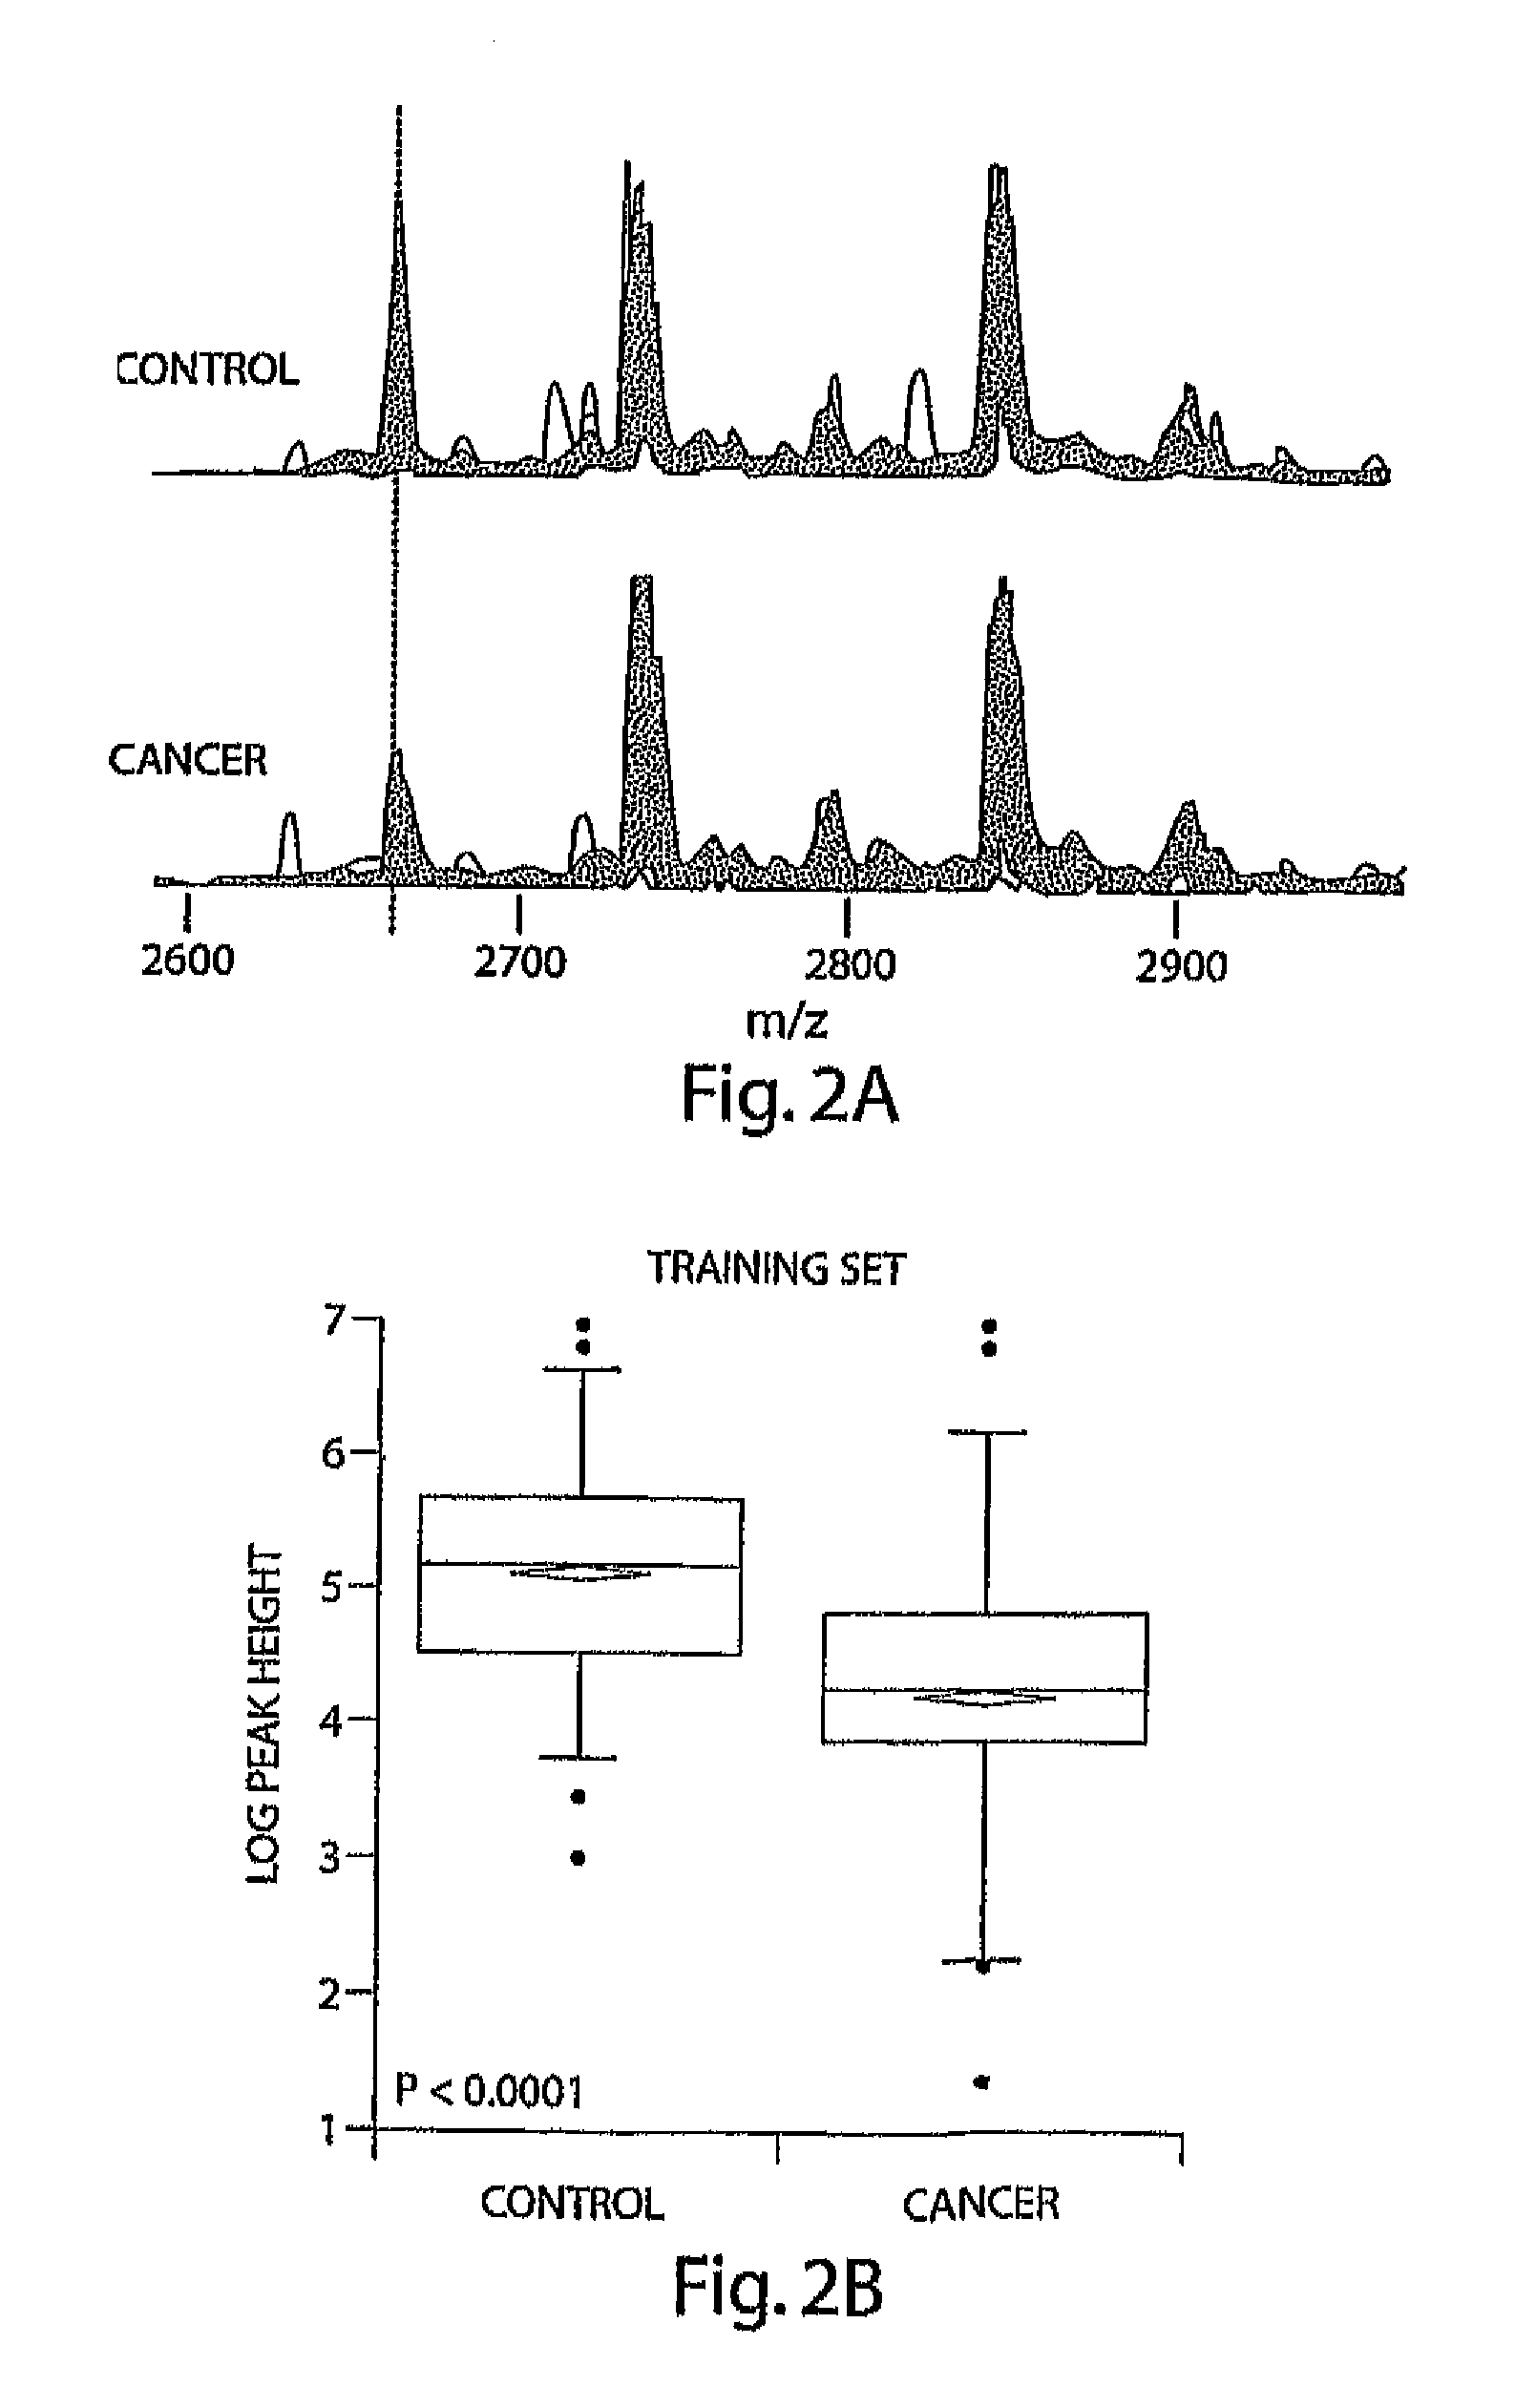
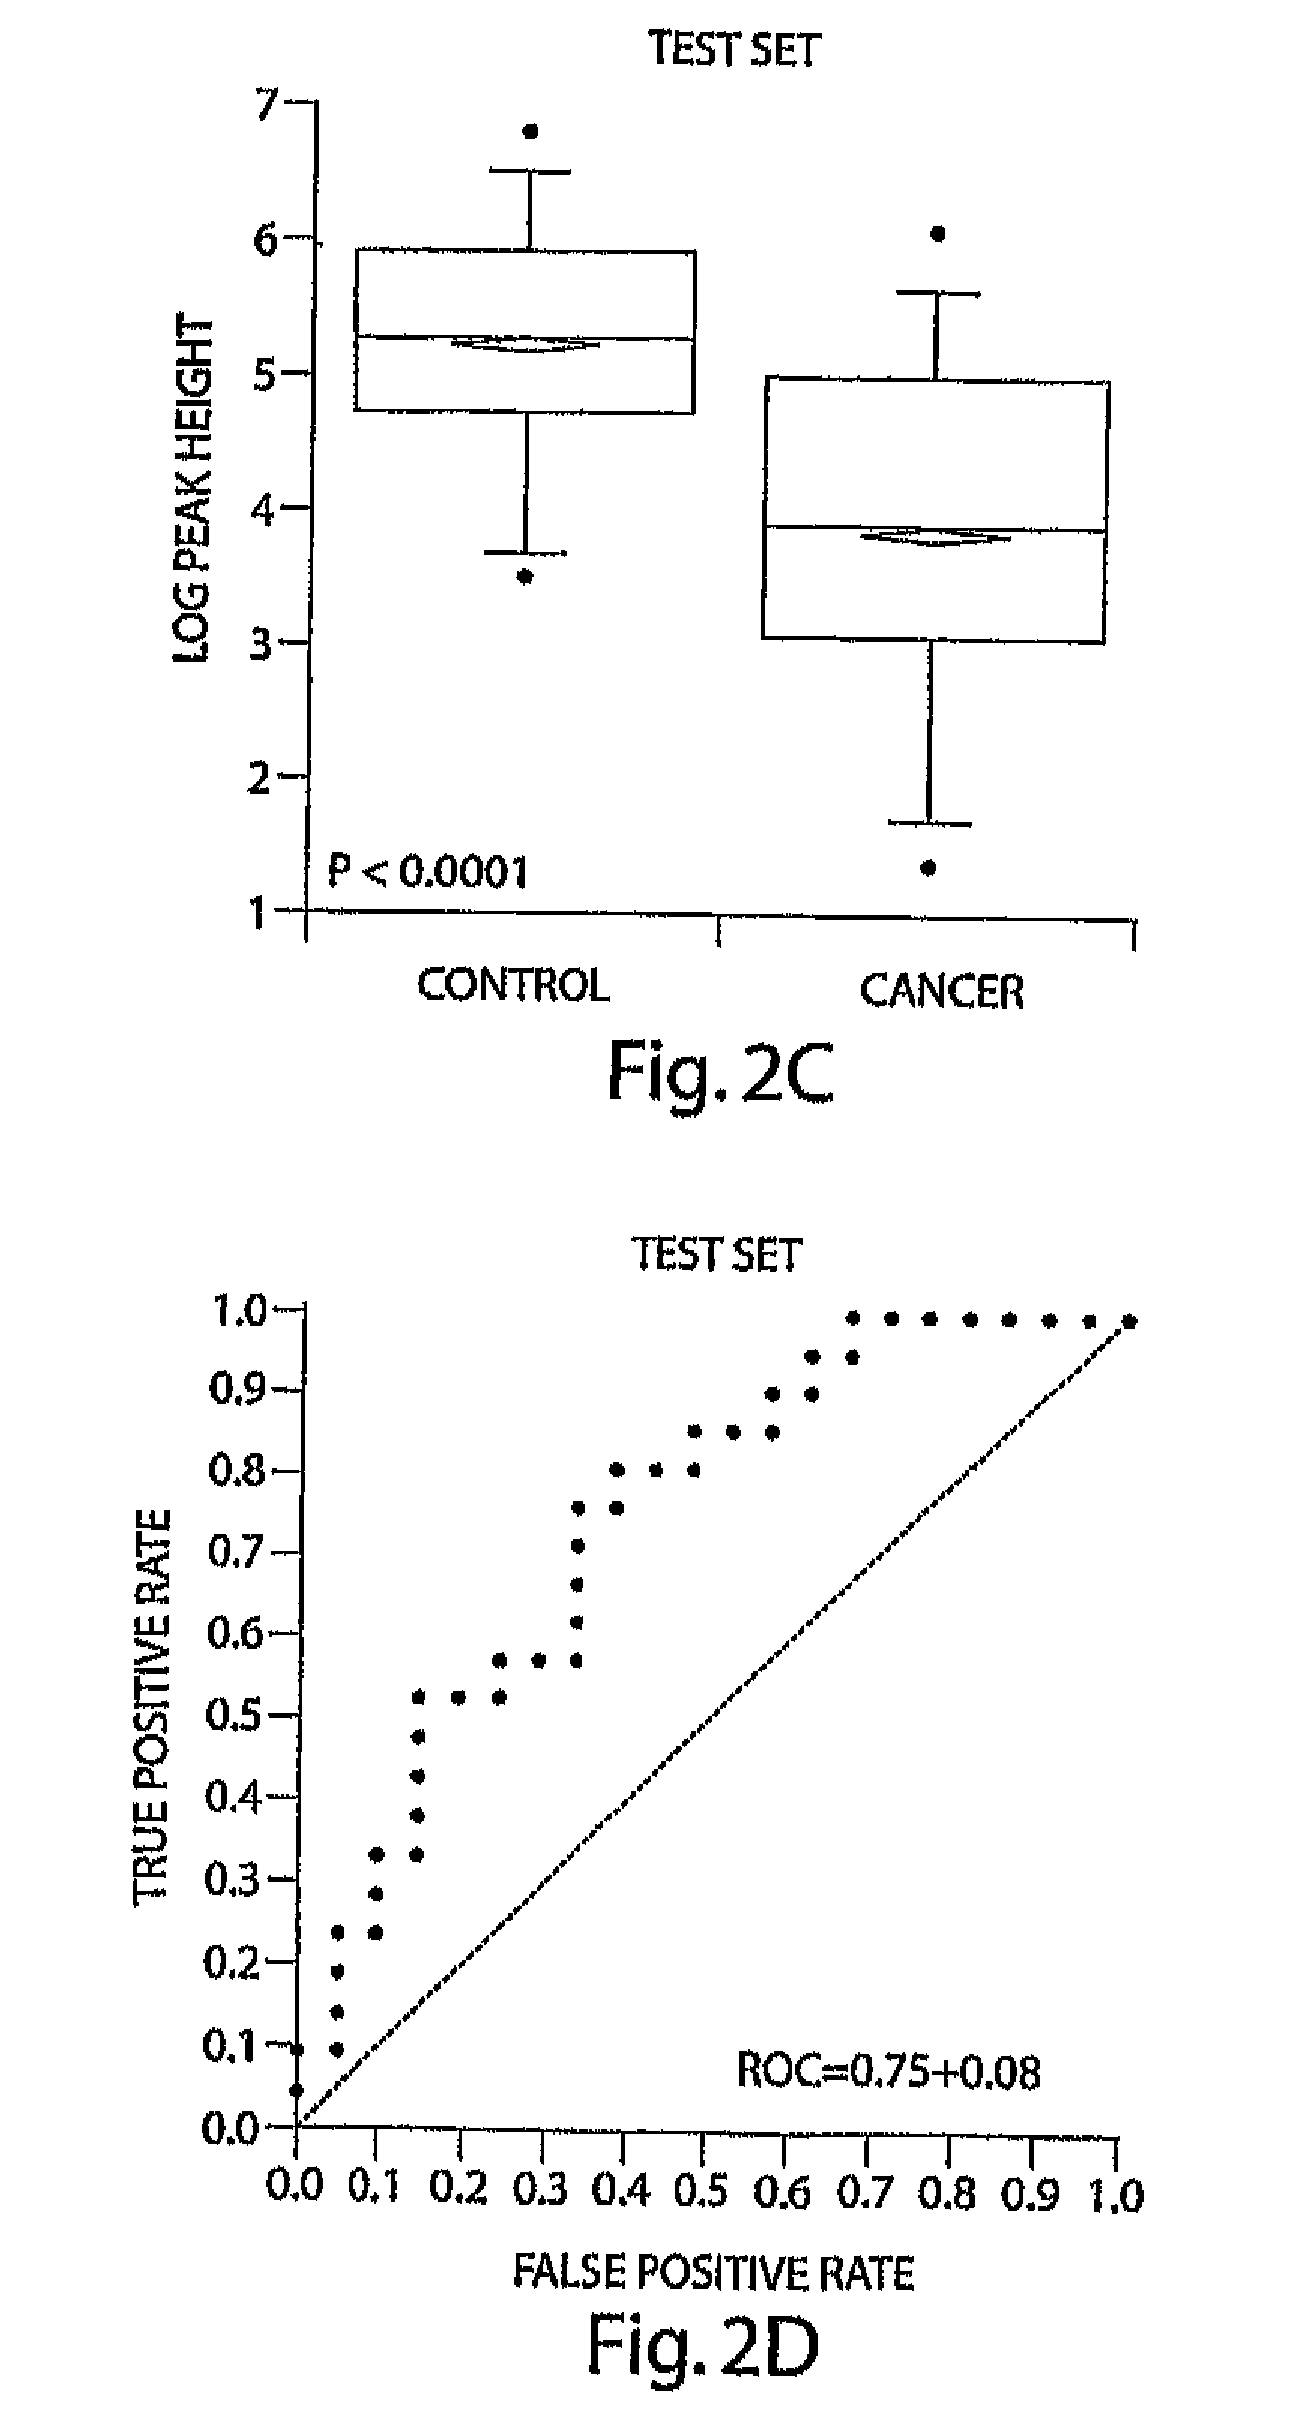
[0089]A marker with an m / z value close to 2660 ranked as the most important according to all 4 statistical methods used; furthermore, this marker appeared in multiple fractions and in samples analyzed after prolonged freezing (Table 2). Superimposed spectra from all cancer and control samples in F23 in the 2600 to 2900 M.& range are shown in FIG. 2A. The overlaid peak height at 2660 is lower in plasma from cancer patients than in the plasma from unaffected controls. To quantitatively show this difference, FIGS. 2B and 2C show box-plots of the peak heights for this biomarker in cancer patients and unaffected controls in the training data set and the test data set, respectively. The expression of this peptide was significantly (T-test, p<0.0001) higher in control vs. cancer patients. The ROC was plotted using this single marker in the test data set and achieved an AUC=0.75, indicating discrimination using this single marker (FIG. 2D).
[0090]Using d...
PUM
| Property | Measurement | Unit |
|---|---|---|
| bed volumes | aaaaa | aaaaa |
| mass to charge | aaaaa | aaaaa |
| density | aaaaa | aaaaa |
Abstract
Description
Claims
Application Information
 - R&D
- Intellectual Property
- Life Sciences
- Materials
- Tech Scout
- Unparalleled Data Quality
- Higher Quality Content
- 60% Fewer Hallucinations
Browse by: Latest US Patents, China's latest patents, Technical Efficacy Thesaurus, Application Domain, Technology Topic, Popular Technical Reports.
© 2025 PatSnap. All rights reserved.Legal|Privacy policy|Modern Slavery Act Transparency Statement|Sitemap|About US| Contact US: help@patsnap.com


