Apparatus and method for measuring differences in the transmission of light through a lens of an eye
a technology of light transmission and eye lens, applied in the field of non-invasive devices, to achieve the effect of quantitative color perception
- Summary
- Abstract
- Description
- Claims
- Application Information
AI Technical Summary
Benefits of technology
Problems solved by technology
Method used
Image
Examples
embodiment 200
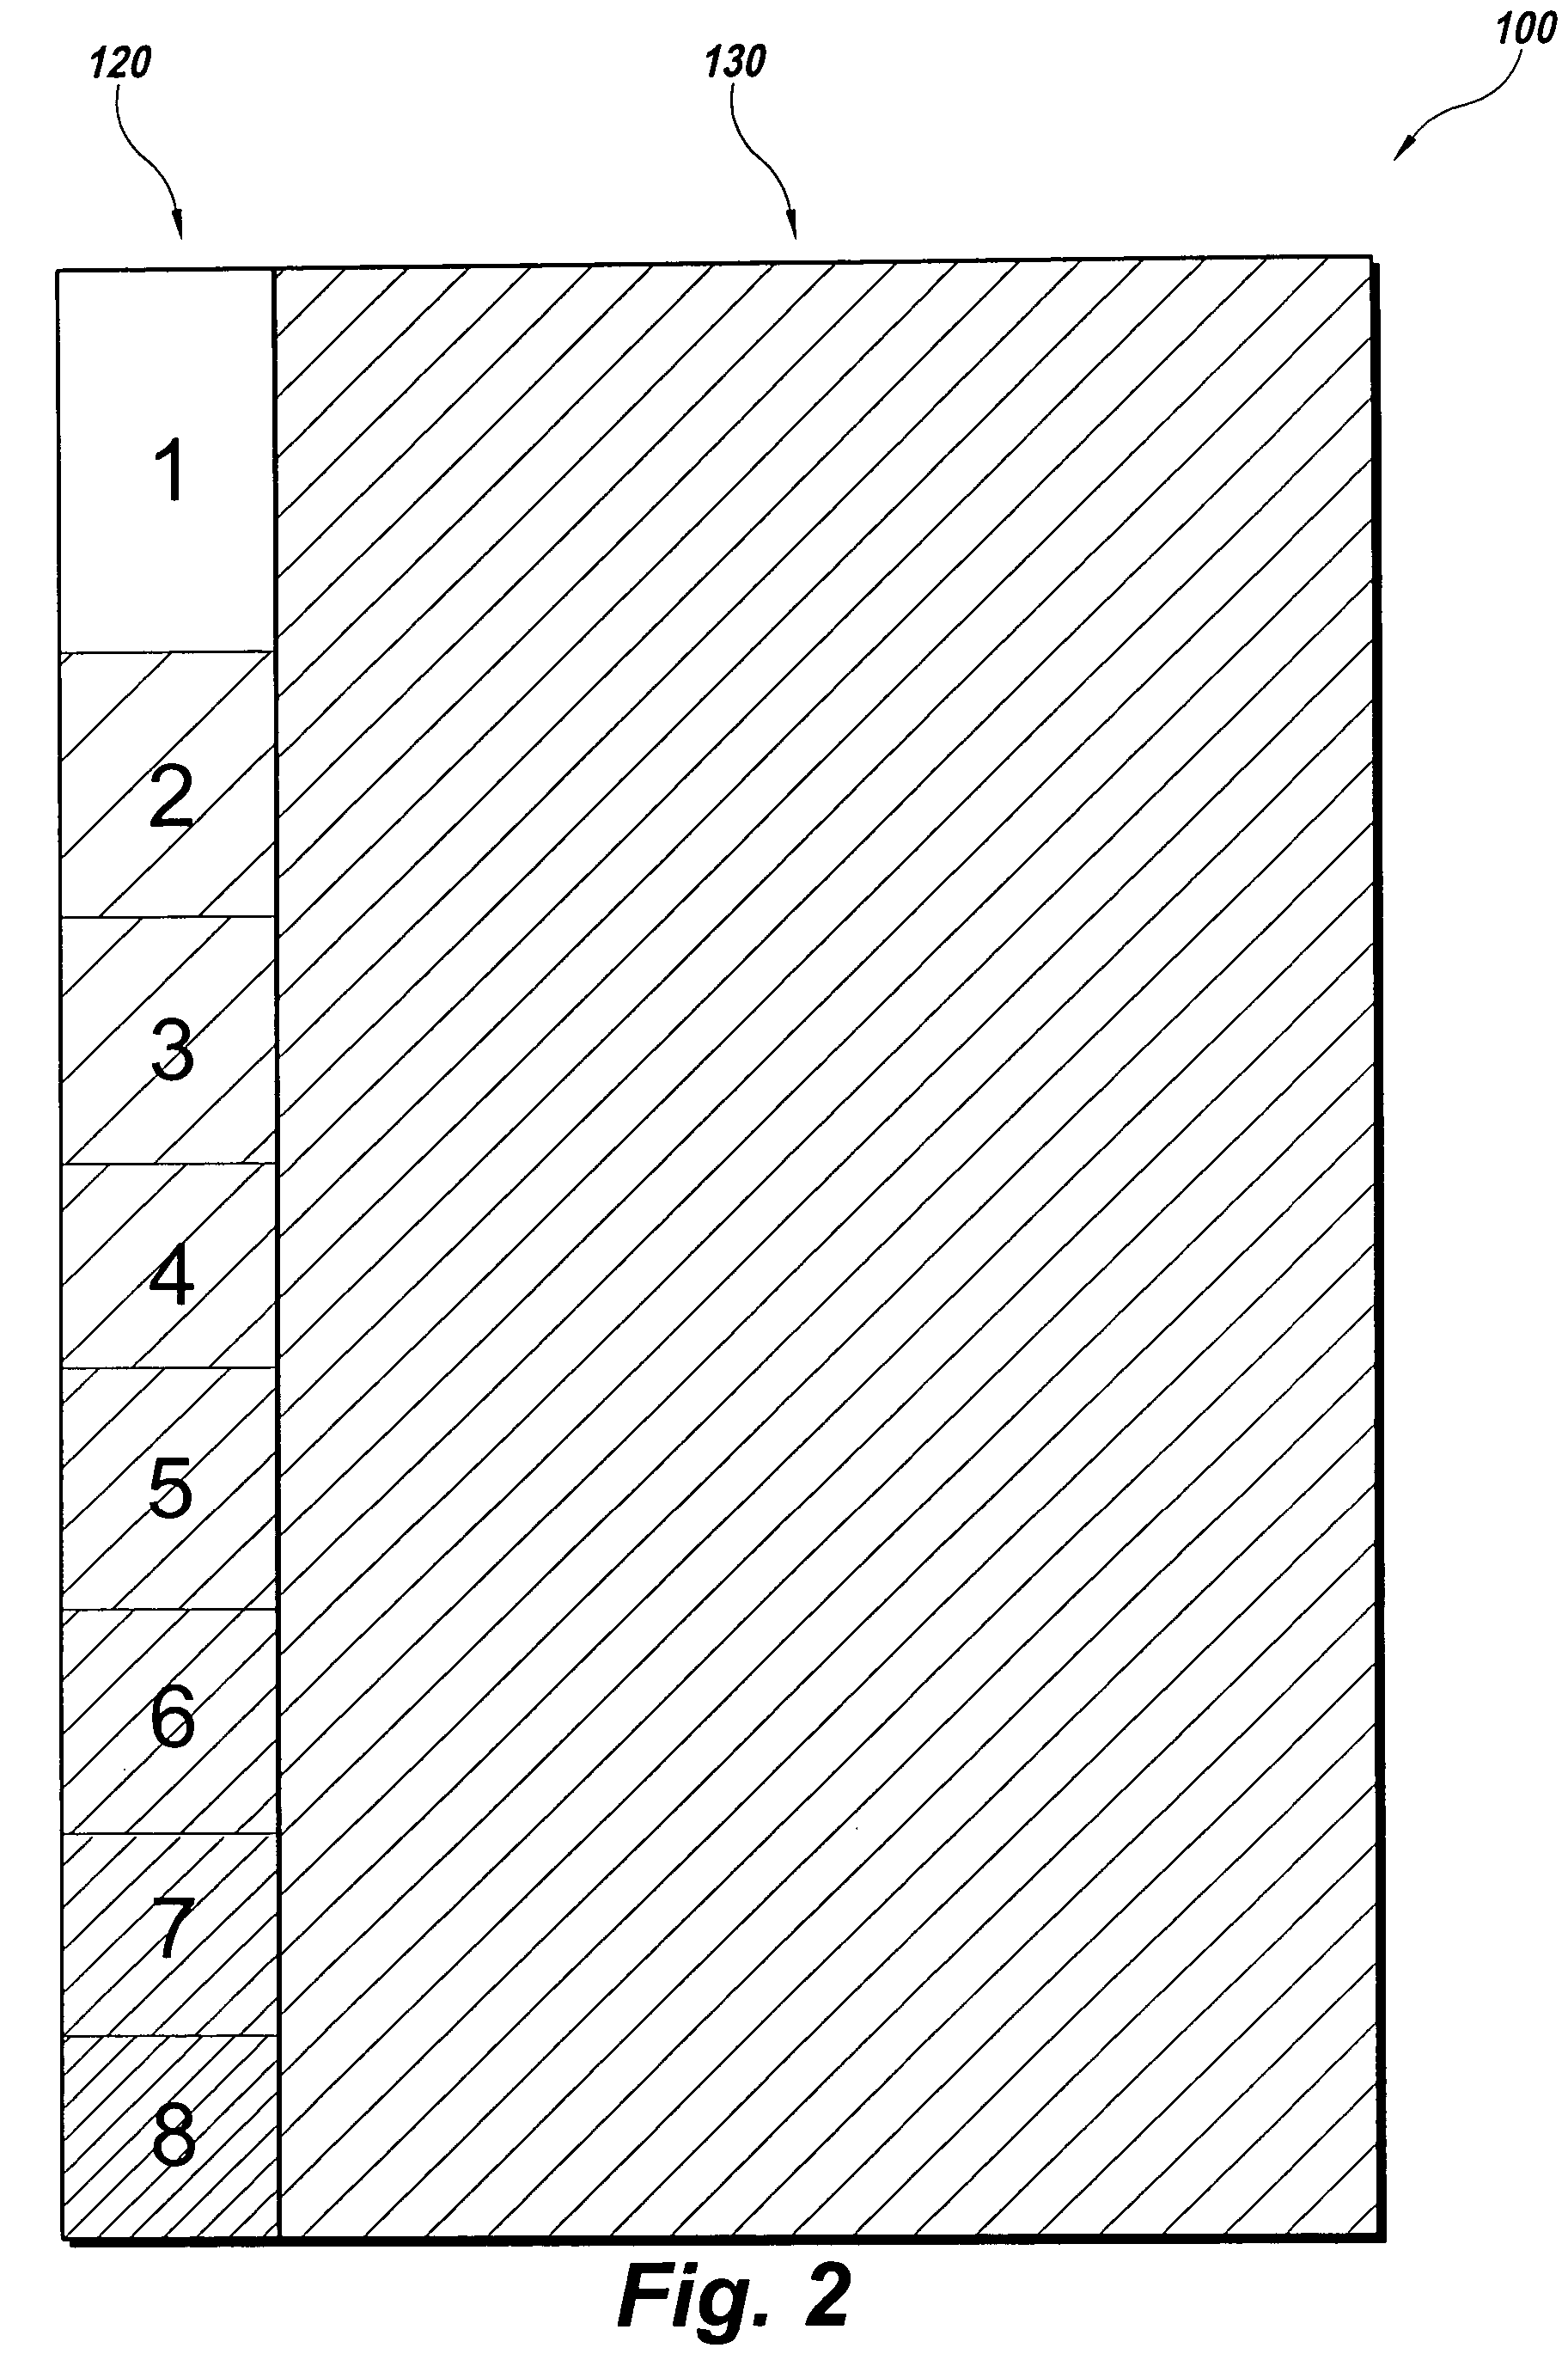
[0038]FIG. 3 shows an alternative eye chart embodiment 200. The chart 200 has a reference section 220 and a test section 230. Here, the test section 230 displays a shade of a color and the reference section 220 displays a spectrum of the same color as that shown in the test section 230. Both sections 220, 230 are further divided into subsections. The reference section 220 displays a plurality of subsections. Each subsection displays a different shade of the test color and an identifying indicia. The test section 230 is separated into two subsections, a color stripe 232 and a vision chart 234.
[0039]The color stripe 232 displays a test color shade that matches one of the reference color shades in the spectrum shown in the reference section 220. The vision chart 234 displays a Snellen Eye Chart; however, other types of vision charts may also be utilized with the eye chart 200, such as a Tumbling E chart, a Tumbling C chart, a hand chart, a symbol chart, or a reversed letter chart. The ...
embodiment 300
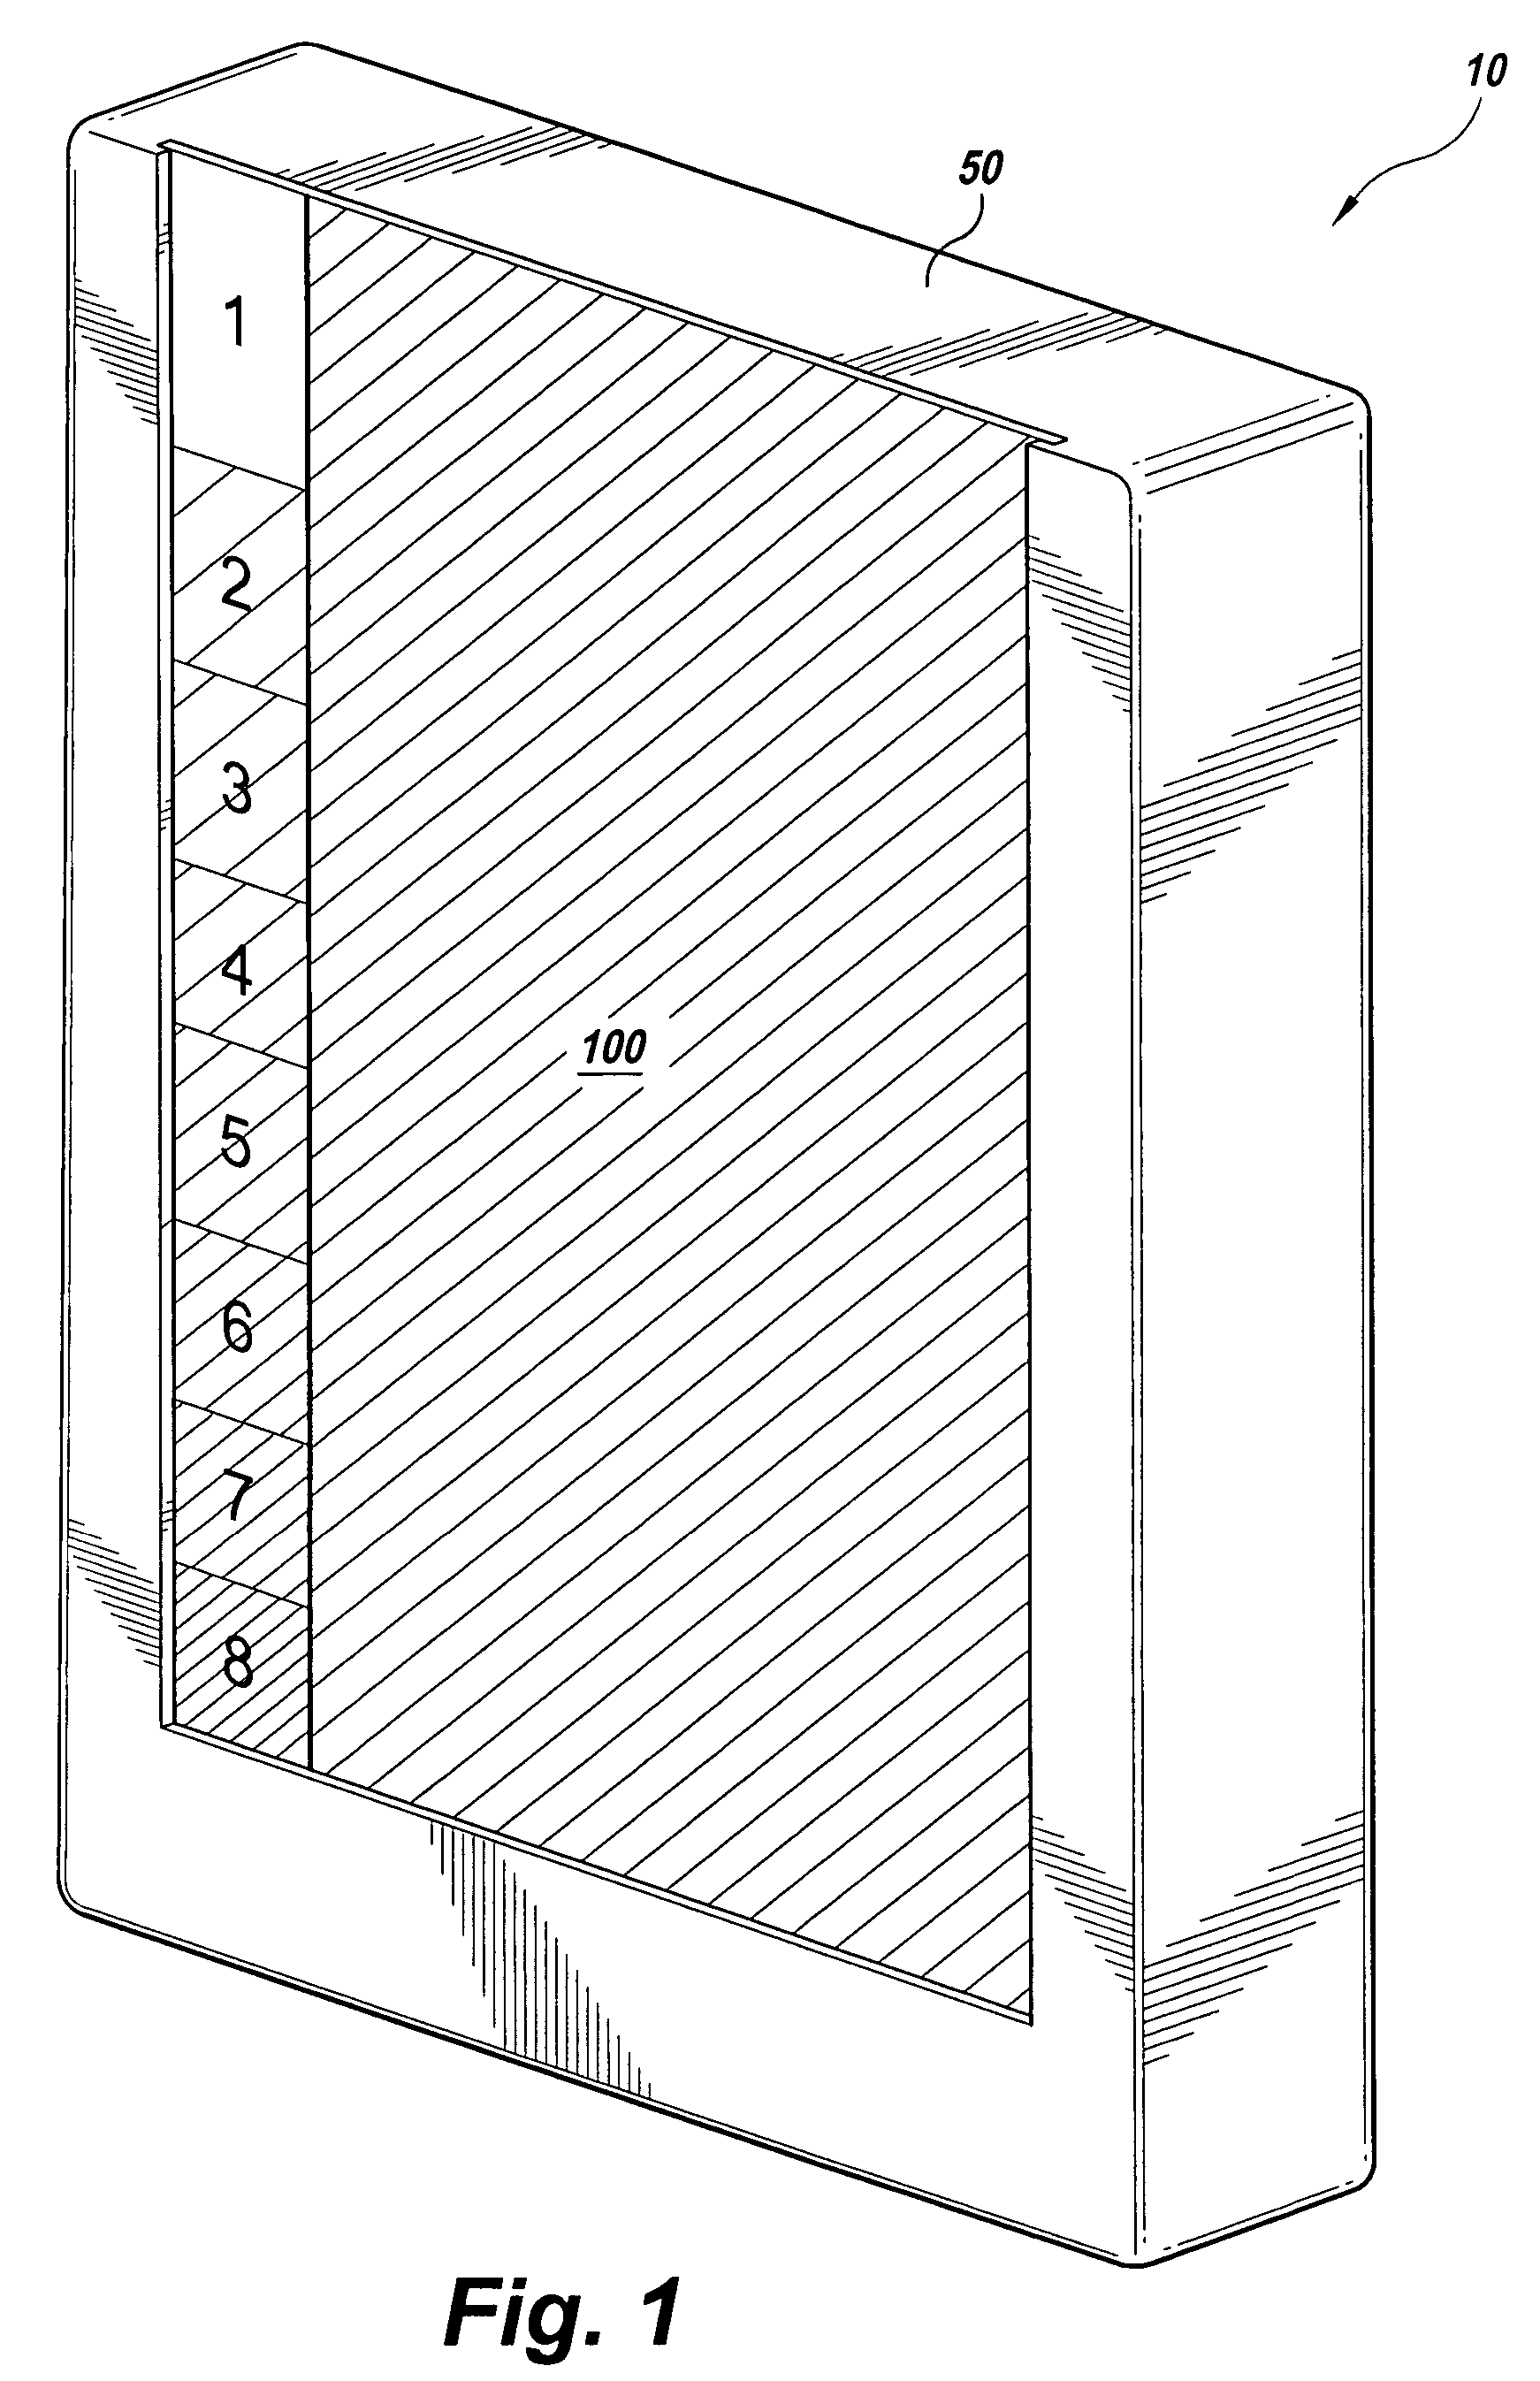
[0040]FIG. 4 shows a third alternative eye chart embodiment 300. The chart 300 displays a reference section 320 and a test section 330. The test section 330 displays both a test color and the Snellen chart simultaneously. The reference section 320 displays a spectrum of the test color with each shade uniquely identified by an indicia and separated into subsections. Charts 200 and 300 would be used the same way as chart 100, being disposed in a display device 50 or as a chart hanging on a wall. Also the charts 200 and 300 could be illuminated using either a constant or variable intensity light source as described with respect to chart 100.
embodiment 400
[0041]FIG. 5 shows a fourth alternative eye chart embodiment 400. The eye chart 400 is divided into equal halves, where one of the halves is designated a reference section 420 and the other half is designated a test section 430. Chart 400, unlike charts 100, 200 and 300, only displays two shades of one color. Each shade is disposed in one of the two sections 420, 430. Chart 400 may be displayed in an illumination cabinet or similar display device 50, as shown in FIG. 1, in an enclosed box 60, as shown in FIG. 6, or using a projector.
[0042]Chart 400 is best displayed in an enclosed box 60 having a controlled and separated light source, as shown in FIG. 6. The box 60 holds the chart 400 and has two light sources 40, 42 disposed behind each section 420, 430 of the chart 400. A divider D separates the light sources 40, 42 so that each light source 40, 42 only illuminates one section. The patient is directed to look through a dual eyepiece E disposed at one end of the box 60 to view the ...
PUM
 Abstract
Description
Claims
Application Information
 - R&D
- Intellectual Property
- Life Sciences
- Materials
- Tech Scout
- Unparalleled Data Quality
- Higher Quality Content
- 60% Fewer Hallucinations
Browse by: Latest US Patents, China's latest patents, Technical Efficacy Thesaurus, Application Domain, Technology Topic, Popular Technical Reports.
© 2025 PatSnap. All rights reserved.Legal|Privacy policy|Modern Slavery Act Transparency Statement|Sitemap|About US| Contact US: help@patsnap.com


