
Method and apparatus for multivariate space processing

a multi-variate space and processing method technology, applied in the field of multi-variate space processing technology and multi-variate space processing methods and apparatuses, can solve the problems of affecting the pace at which the overall research process can be conducted, and the computational load of even a basic scientific visualization can be quite large, so as to achieve simple and efficient computation and reduce computational load

Inactive Publication Date: 2006-04-25
JBF PARTNERS
View PDF12 Cites 10 Cited by
  • Summary
  • Abstract
  • Description
  • Claims
  • Application Information

AI Technical Summary

Benefits of technology

[0006]The present invention has been made in view of the foregoing circumstances and an object thereof is to provide a technique by which the time-varying behaviour of three-dimensional objects can be visualized or displayed with a reduced computational load. Another object of the present invention is to provide a technique by which the structure of or changes in a multivariate space having a dimension greater than three can be visualized or displayed in a simple and efficient manner.
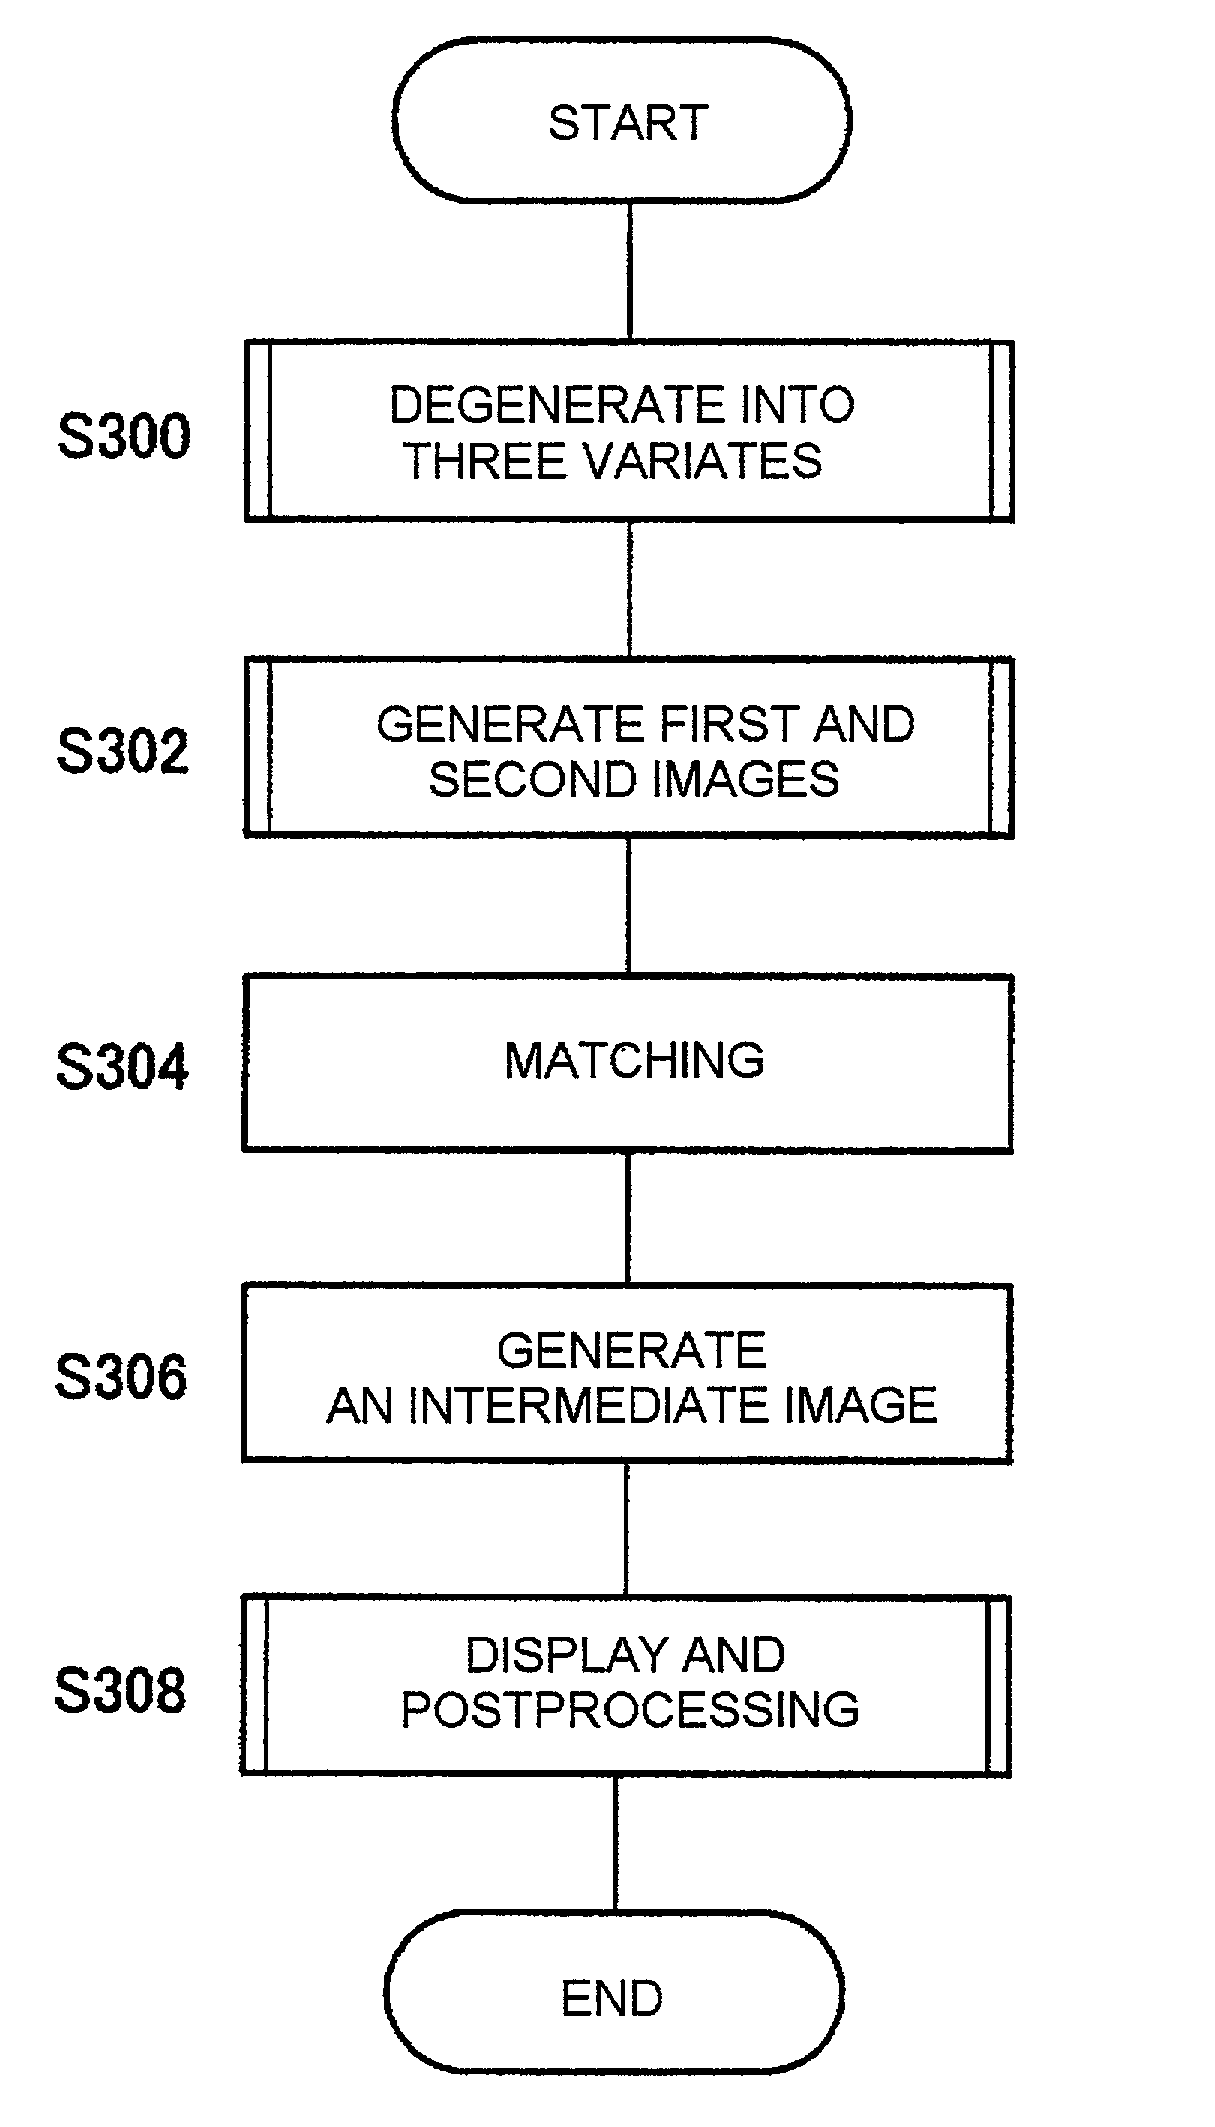
[0010]As an example, consider the case where the reference variate t is time. Now, the remaining two variates x and y can be used to define a first two-dimensional space, sometimes called the first image, at time t=t0 and a second two-dimensional space, sometimes called the second image, at time t=t1. If an image matching is computed between the first and second images, the approximate behavior of the two variates x and y in the region t=[t0, t1] can be determined. In this case, it suffices to compute a matching between the two-dimensional images, and the computational load can be reduced by selecting a suitable algorithm. The “base technology” described later provides one such suitable algorithm and contributes to producing a suitable visualization.
[0012]By adopting the above-described methods while reducing the number of parameters to three, a stock price model can be simultaneously simplified and optimized. The methods may be stated from a more general perspective as: viewing a multidimensional phenomenon or object from various angles while reducing parameters one at a time, conducting an inspection to find an angle at which a most characteristic image is obtained, and repeating a degeneration to view the object at that particular angle. Using a simple example, consider a case where a three-dimensional object is projected as a “shadow picture” on a plane. There will generally be an angle at which the original object can be relatively easily grasped or understood from the shadow picture. A projection operation using this angle corresponds to the degeneration.
[0015]Another preferred embodiment according to the present invention relates also to a multivariate space processing method that includes: acquiring a first image and a second image by projecting three-dimensional data on a predetermined plane; and computing a matching between the first image and the second image. By implementing this method, after the three-dimensional data of, for example, a tornado are projected on a two-dimensional plane to create the first and second images, intermediate states in a region of time t=[t0, t1] can be visualized by interpolating the two-dimensional images for time t=t0 and time t=t1. Computationally, once the matching is completed, there will not be much time needed for the interpolation. Moreover, since the interpolation can be performed at any point in the region by arbitrarily varying the time t, the computational load becomes extremely low compared to conventional visualization, in which a three-dimensional computation is performed sequentially. Thus, this embodiment is effective particularly when one wants to quickly visualize a phenomenon or simulation in as simplified and convenient a manner as possible.

Problems solved by technology

However, in actuality, the creation of a scientific visualization will generally involve a series of relatively complex processes such as setting up complex equations and functions, tracing time-varying values of each point in the n-dimensional space, and converting this large amount of data to a display space.
Thus, the computational load for even a basic scientific visualization can be quite large, so that, in many cases, the amount of time and effort required to complete the scientific visualization adversely affects the pace at which the overall research processes can be conducted.

Method used


Image

  • Method and apparatus for multivariate space processing
  • Method and apparatus for multivariate space processing
  • Method and apparatus for multivariate space processing

Examples


Embodiment Construction

[0061]The invention will now be described based on the preferred embodiments, which are not intended to limit the scope but to exemplify the present invention. All of the features and the combinations thereof described in the embodiments are not necessarily essential to the invention.

[0062]First, the multiresolutional critical point filter technology and the image matching processing using the technology, both of which will be utilized in the preferred embodiments, will be described in detail as “Base Technology”. Namely, the following sections [1] and [2] (below) belong to the base technology, where section [1] describes elemental techniques and section [2] describes a processing procedure. These techniques are patented under Japanese Patent No. 2927350 and owned by the same assignee of the present invention. As described in more detail below following the discussion of the base technology, according to the embodiments of the present invention there is provided a mesh on an image, ...


PUM


Abstract

A multivariate space processing apparatus and method in which visualization is carried out by image processing alone and without a modeling process. In the apparatus, a preprocessing unit degenerates multivariate data into three variates; a conversion unit specifies a reference variate among the three variates, then determines values for the two remaining variates at two predetermined values of the reference variate, so that a first image and a second image based on the two remaining variates and corresponding to the two predetermined values are generated; a matching processor computes a matching between the first image and the second image; and an intermediate image generator generates an intermediate image of the first and second images based on the matching. Preferably, a display control unit displays the intermediate image on a display.

Description

BACKGROUND OF THE INVENTION[0001]1. Field of the Invention[0002]The present invention relates to a multivariate space processing technology and multivariate space processing method and apparatus, and more particularly relates to a method and apparatus for predicting, interpolating and displaying multivariate data.[0003]2. Description of the Related Art[0004]Scientific visualization is often used as a tool to allow a user to intuitively grasp or understand complex phenomena and large-scale data. For example, in order to visualize time-varying complex three-dimensional phenomena such as ocean currents or tornados, density and other attributes of each point in the three-dimensional space are assigned for each voxel and time-varied values are computed sequentially and displayed, so that a general structure and motion of the large-scale data can be approximated. Besides grasping a phenomenon as a whole, visualization is also used as a tool to gauge the effectiveness of a hypothetical mod...

Claims


Application Information

Patent Timeline
Patent Type & Authority Patents(United States)
IPC IPC(8): G06K9/00G06T7/00G06T7/60G06T17/00
CPCG06T17/00
Inventor AKIYOSHI, KOZOAKIYOSHI, NOBUO
Owner JBF PARTNERS
Learn More