Electronic map display declutter

a technology of electronic map and display, applied in the direction of instruments, surveying and navigation, navigation instruments, etc., can solve the problems of losing individual significance, not having the size or resolution of most paper charts, and becoming much less effectiv

Inactive Publication Date: 2005-12-06
HONEYWELL INT INC
View PDF3 Cites 29 Cited by
  • Summary
  • Abstract
  • Description
  • Claims
  • Application Information

AI Technical Summary

Problems solved by technology

Electronic map display screens, especially those used in aircraft may be only 10–30 cm across and do not have the size or resolution of most paper charts.
When too many symbols are presented at the same time their individual significance is lost.
Under these circumstances, the electronic map display is so “cluttered” that it becomes much less effective.
In FIG. 1B the much larger number of symbols 14 located within the larger range causes the “clutter” to be so severe that the individual symbols lose much of their meaning or are hard to distinguish individually.
Thus, one of the biggest problems on the limited display area available for electronic map displays is how to declutter the display when there are a lot of important features (symbols) to be shown, in a manner that insures that the most important information is still being presented.
These preset thresholds are not necessarily appropriate in different areas of the world.
Conversely an area of Montana might support a much larger range without making the display seem too crowded but the display is under-utilized because of the range-based thresholds.
Thus, the prior art approach does not provide the optimal symbol density in many geographical areas.

Method used


Image

  • Electronic map display declutter
  • Electronic map display declutter
  • Electronic map display declutter

Examples


first embodiment

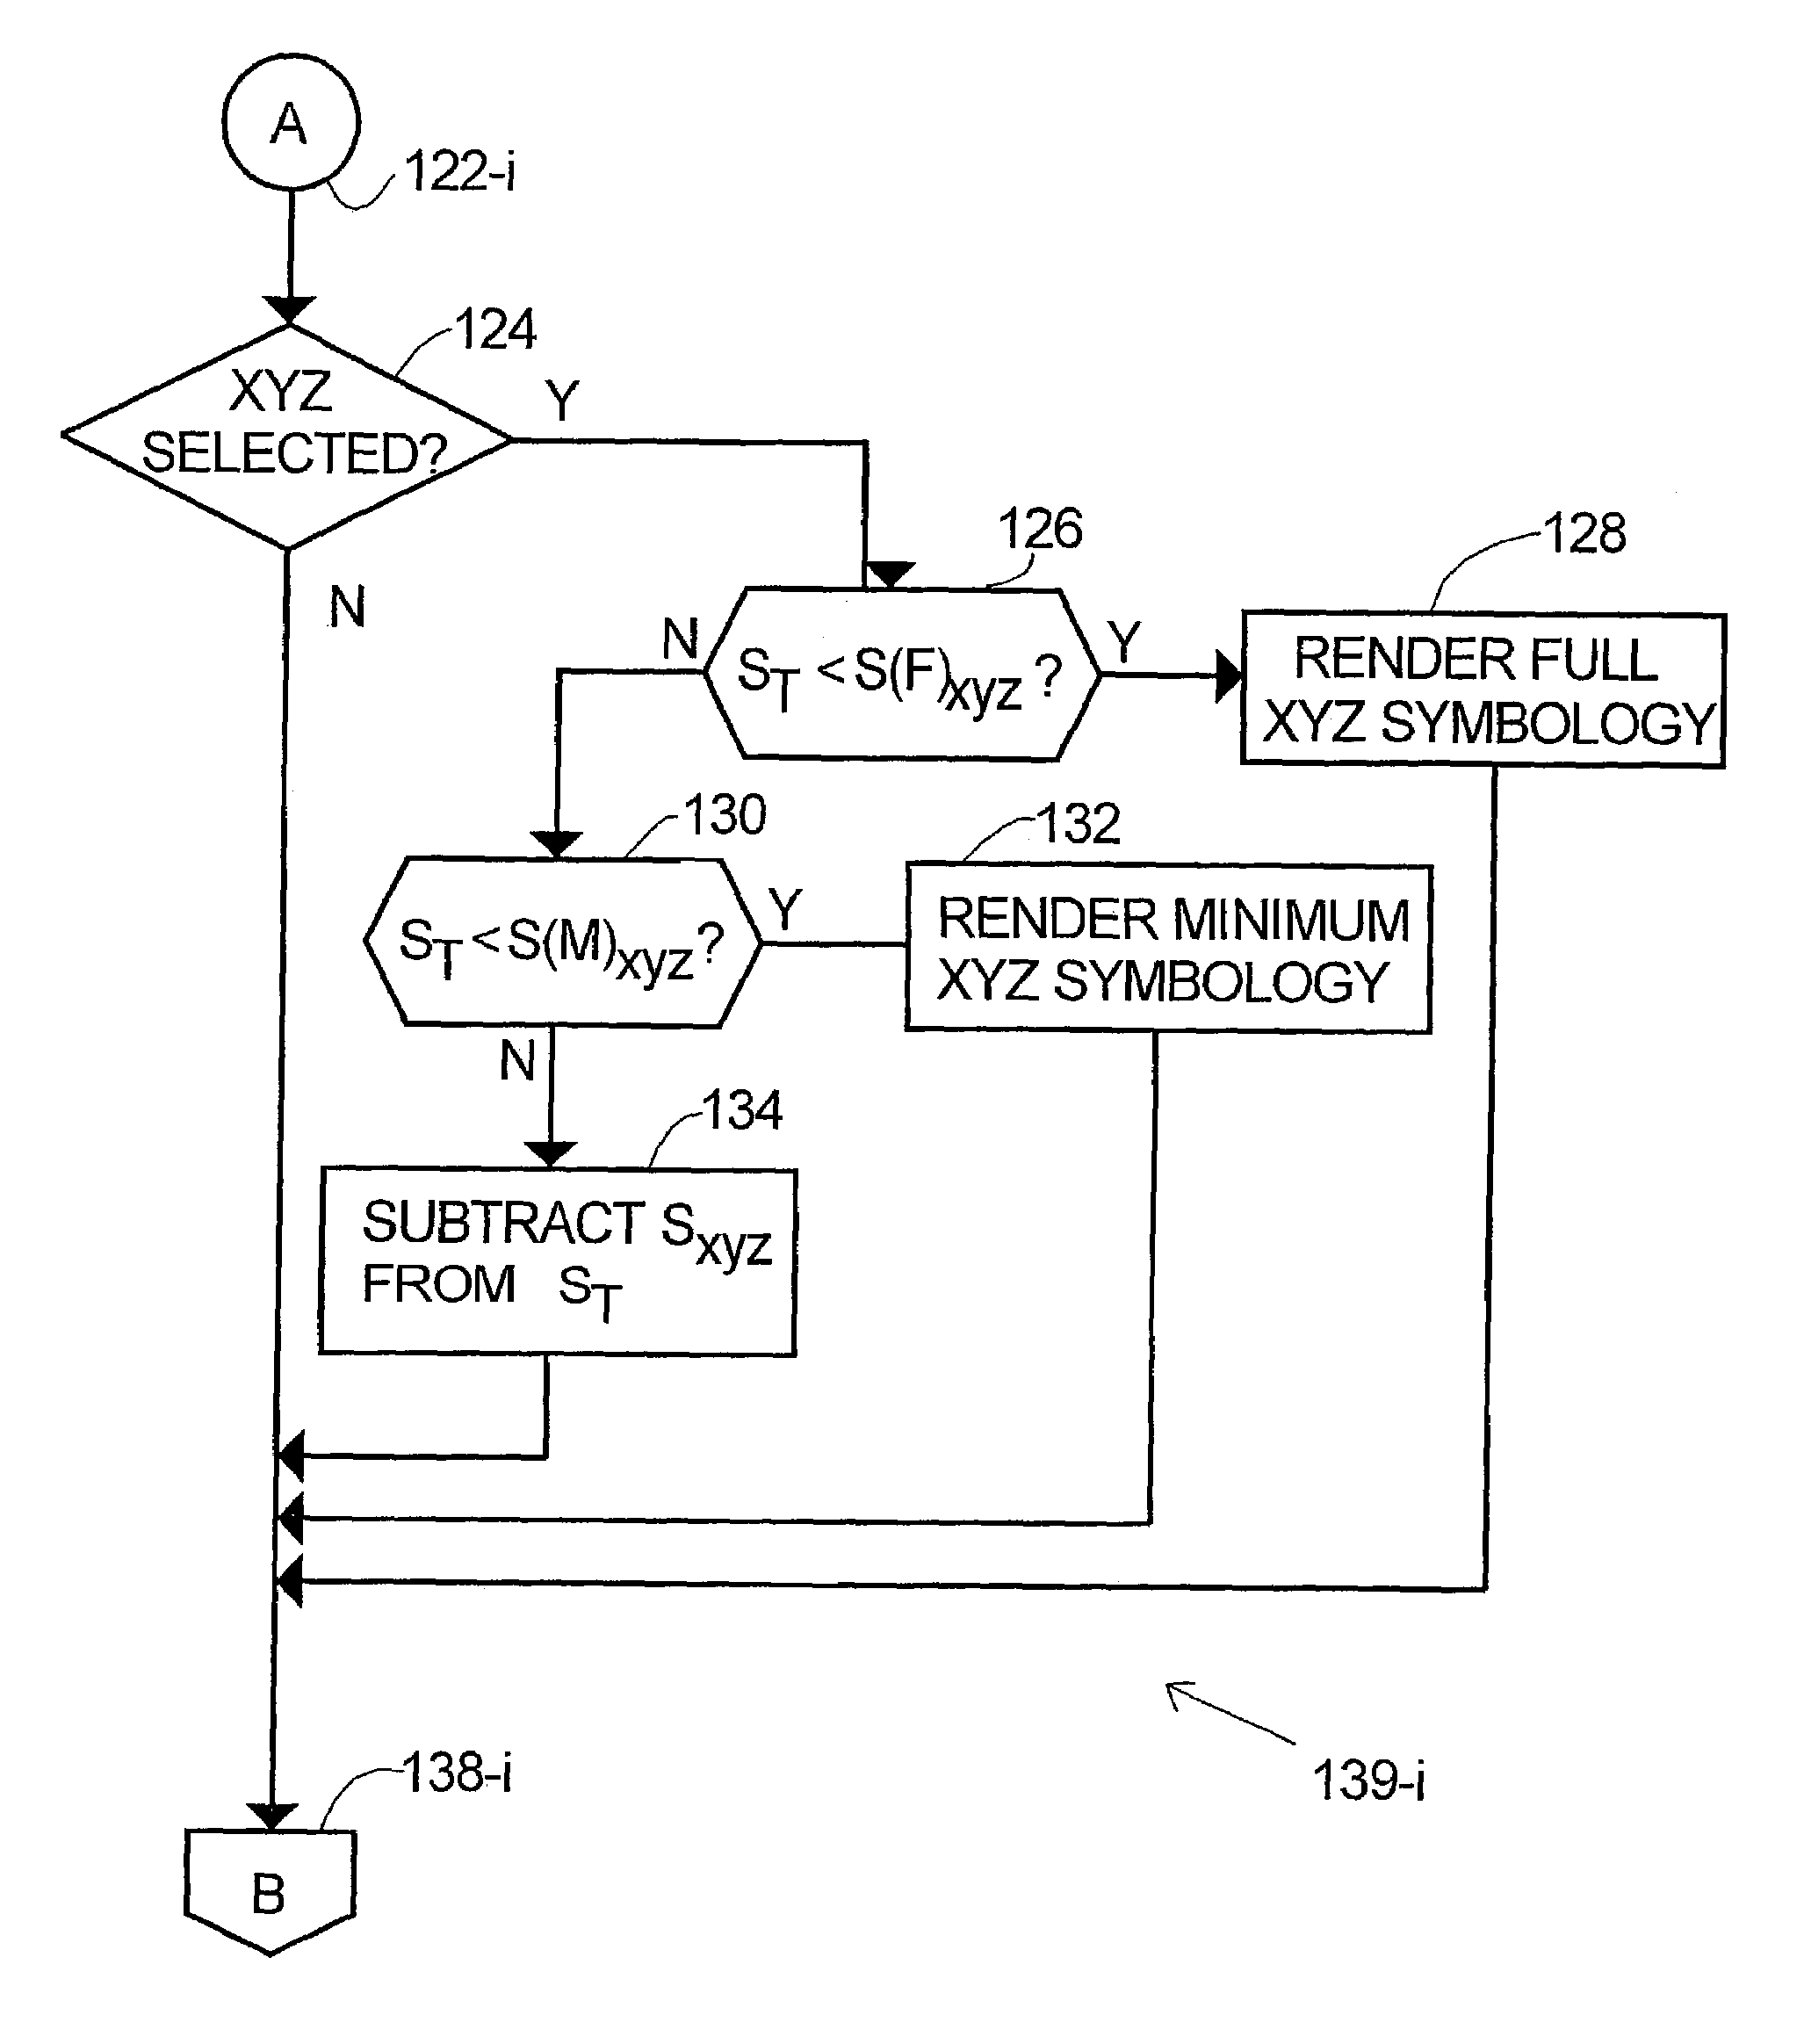
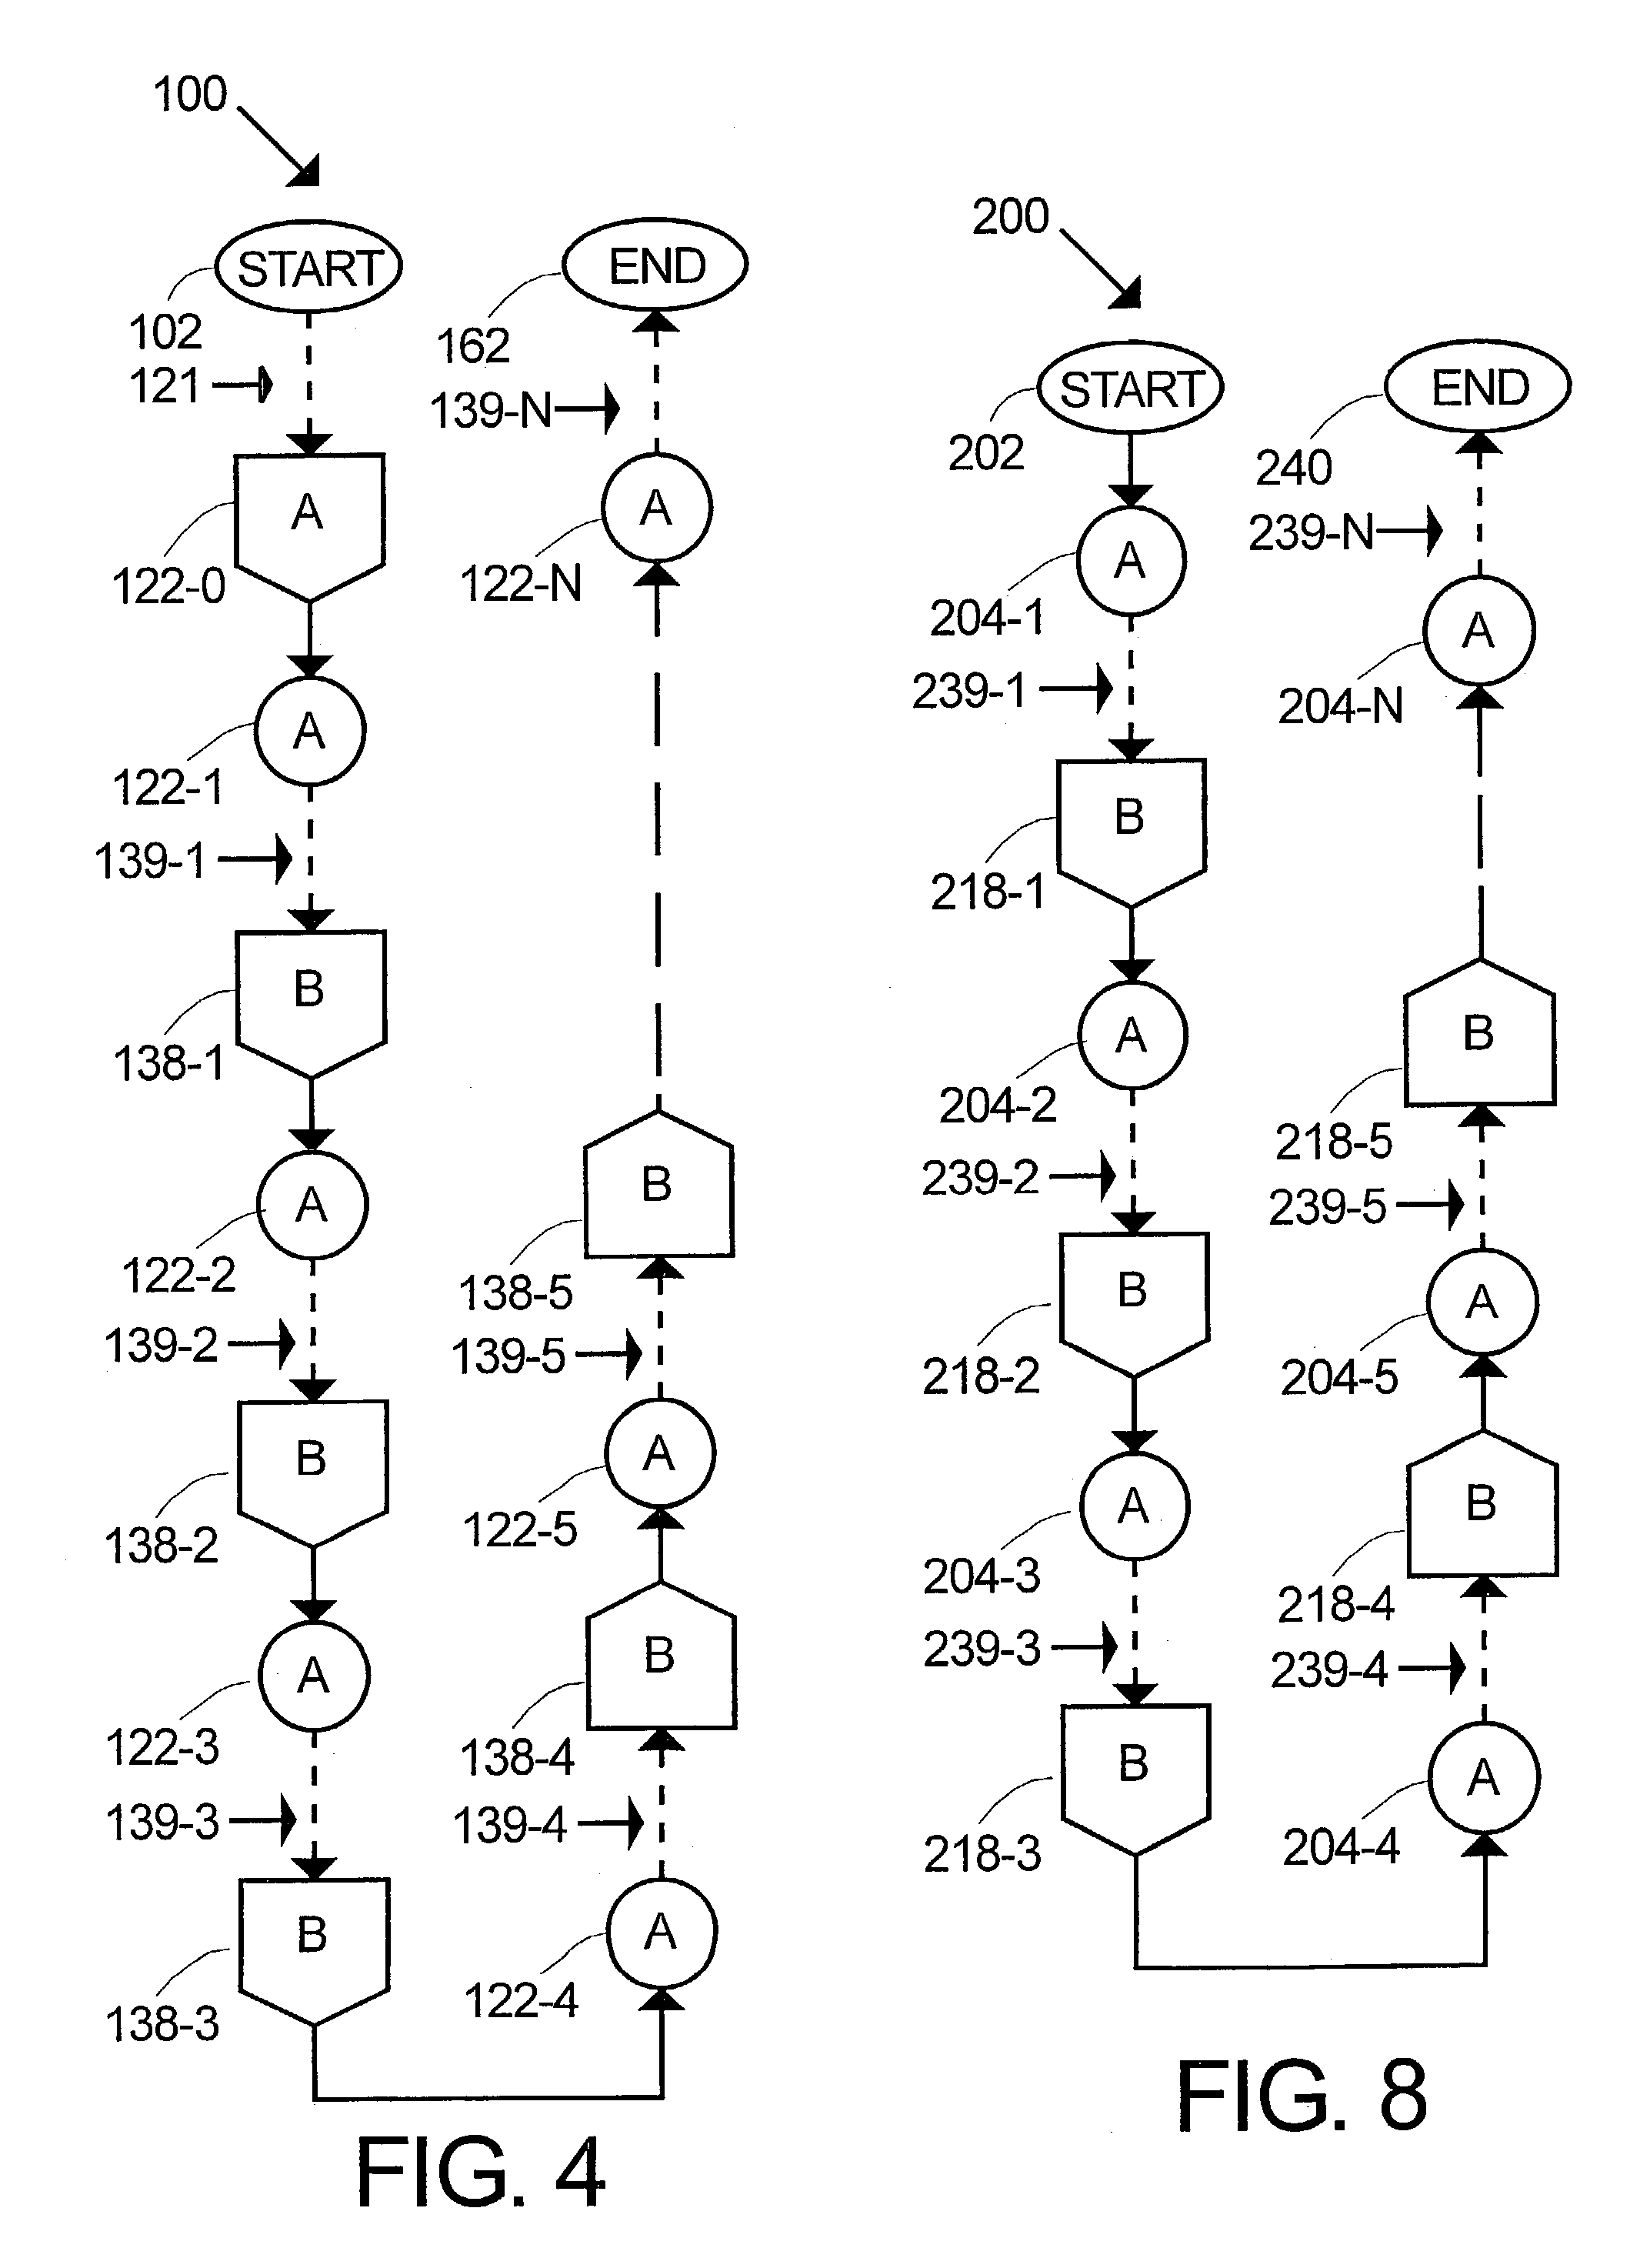
[0029]FIG. 4 illustrates the method of the present invention wherein the total available symbol count ST is determined for the symbol types that have been selected by the user and then ST is used to declutter the display. FIG. 4 is a global overview of the method of the present invention using the total available symbol count ST. Beginning at START 102, process 100 first executes sub-process 121 described in FIG. 5 and then executes sequentially sub-processes 139-i, e.g., 139-1, 139-2, 139-3 . . . 139-N, where N is the total number of map symbol types (e.g., VOR, NDB, ILS, APT, etc.) desired to be displayed. Sub-process 139-i is described in FIG. 6. When the last occurrence 139-N of sub-process 139-i has run, method 100 terminates at END 162

[0030]Referring now to FIG. 5, following START 102, in step 104 the symbol count ST is set to zero, i.e., ST=0. In successive query steps 106, 110, 114, 118 it is determined whether a particular symbol type, e.g., VOR, NDB, ILS, APT, etc. has bee...

second embodiment

[0039]FIG. 8 is a simplified flow chart similar to FIG. 4, but of decluttering method 200 according to the present invention. Method 200 carries out decluttering based on the number of symbols of each type rather than on the total number of symbols of all types. Following START 202, method 200 executes sub-processes 239-i (see FIG. 9) for i=1 to N, in a way analogous to sub-process 139-i in FIG. 4. Sub-processes 239-i correspond to each symbol type desired to be displayed. Sub-process 239-i, analogous to sub-process 139-i of FIG. 6, is shown in FIG. 9 and sub-process 239′ analogous to sub-process 139′ in FIG. 7 is shown in FIG. 10. When last sub-process 239-N (or 239′-N) is completed then method 200 is complete at END 240 where the symbols of each type to be presented FULL or MINIMUM are known. The value of N depends upon the number of symbol types selected for display by the user and correspondingly fewer or more sub-processes 239-i are included in method 200 as required.

[0040]FIG....


PUM


Abstract

Method, apparatus and program product are provided for controlling the number of symbols presented on an vehicle electronic map display by using a first threshold constant for the number of symbols to be presented in FULL detail and a second threshold constant for the number of symbols to be presented in MINIMUM detail. In a first embodiment, the total number of selected symbols is compared to the threshold constants for each symbol type. In a second embodiment, the number of symbols of each type is compared to the respective threshold constants for each type. Excessive map clutter is avoided without regard to the map range selected by the user and for both high density and sparse map regions.

Description

FIELD OF THE INVENTION[0001]The present invention generally relates to an improved means and method for controlling the amount of data presented on an electronically generated map, and more particularly to decluttering electronic map displays used in aircraft and other vehicles.BACKGROUND OF THE INVENTION[0002]The present invention is described by way of example for electronic map displays in aircraft, but those of skill in the art will understand that this is merely for convenience of explanation and is not intended to be limiting and that the present invention applies to electronic map displays of all kinds whether static map displays or moving map displays. As used herein, the word “aircraft” is intended to include all types of vehicles whether in air, at sea or on land and that the invention also applies to static applications where the map display is fixed in space and to moving map displays where the electronically generated map appears to move with respect to the map observer...

Claims


Application Information

Patent Timeline
Patent Type & Authority Patents(United States)
IPC IPC(8): G01C23/00
CPCG01C23/00
Inventor GIBBS, MICHAEL J.
Owner HONEYWELL INT INC
Why Eureka
Try Eureka