
Method, computer program, and system for automated real-time signal analysis for detection, quantification, and prediction of signal changes

a real-time signal and computer program technology, applied in error detection/correction, instruments, fluid pressure measurement, etc., can solve problems such as lack of robustness, common use approaches, and inability to detect all types of changes in feature distribution through monitoring individual parameters

Inactive Publication Date: 2004-07-27
FLINT HILLS SCI L L C
View PDF18 Cites 186 Cited by
  • Summary
  • Abstract
  • Description
  • Claims
  • Application Information

AI Technical Summary

Benefits of technology

Enables efficient detection and quantification of changes in diverse signal types, allowing for prediction of future events and improving system adaptability, with potential for implantable medical devices with extended operational lifetimes.

Problems solved by technology

Unfortunately, these commonly used approaches have significant drawbacks, including lack of robustness in the presence of signal outliers.
Furthermore, in all but a few ideal cases, monitoring these individual parameters does not enable detection of all types of changes in feature distribution.
Another problem that plagues many existing analysis techniques is that they are unable to deal adequately with real-world problems in which the analyzed signal is often highly complex, non-stationary, non-linear, and / or stochastic.
Although the prior invention disclosed in U.S. Pat. No. 5,995,868 has successfully addressed many of the above-mentioned limitations, including normalization problems associated with complex non-stationary signals, it is lacking in breadth of scope.
Additionally, the order statistic filter employed to detect signal changes requires large amounts of processing ability, memory, and power when used on digital signals for which sorting procedures are performed at each point in time.
Furthermore, the method does not enable full analog implementation.
Most work on order statistic filters, such as median filters, and their implementation is in the areas of digital signal and image processing, which, as mentioned, requires large amounts of processing ability, memory, and power not practical or cost-effective for some applications.
Work on analog median filters is limited to situations where the input is provided as parallel lines of data, and a program or circuit that implements the filter outputs a value that is equal to the median of the data on different input lines.
Work on analog median filtering for continuous-time signals is not extensive, and no realizable implementations exist able to track a percentile (e.g., median) of a continuous-time signal.
One reason for this is that the operation of finding the rank or order is non-linear, making modeling the procedure using an ordinary differential equation so complicated that it has not yet been addressed.

Method used


Image

  • Method, computer program, and system for automated real-time signal analysis for detection, quantification, and prediction of signal changes
  • Method, computer program, and system for automated real-time signal analysis for detection, quantification, and prediction of signal changes
  • Method, computer program, and system for automated real-time signal analysis for detection, quantification, and prediction of signal changes

Examples


example

Financial Analysis

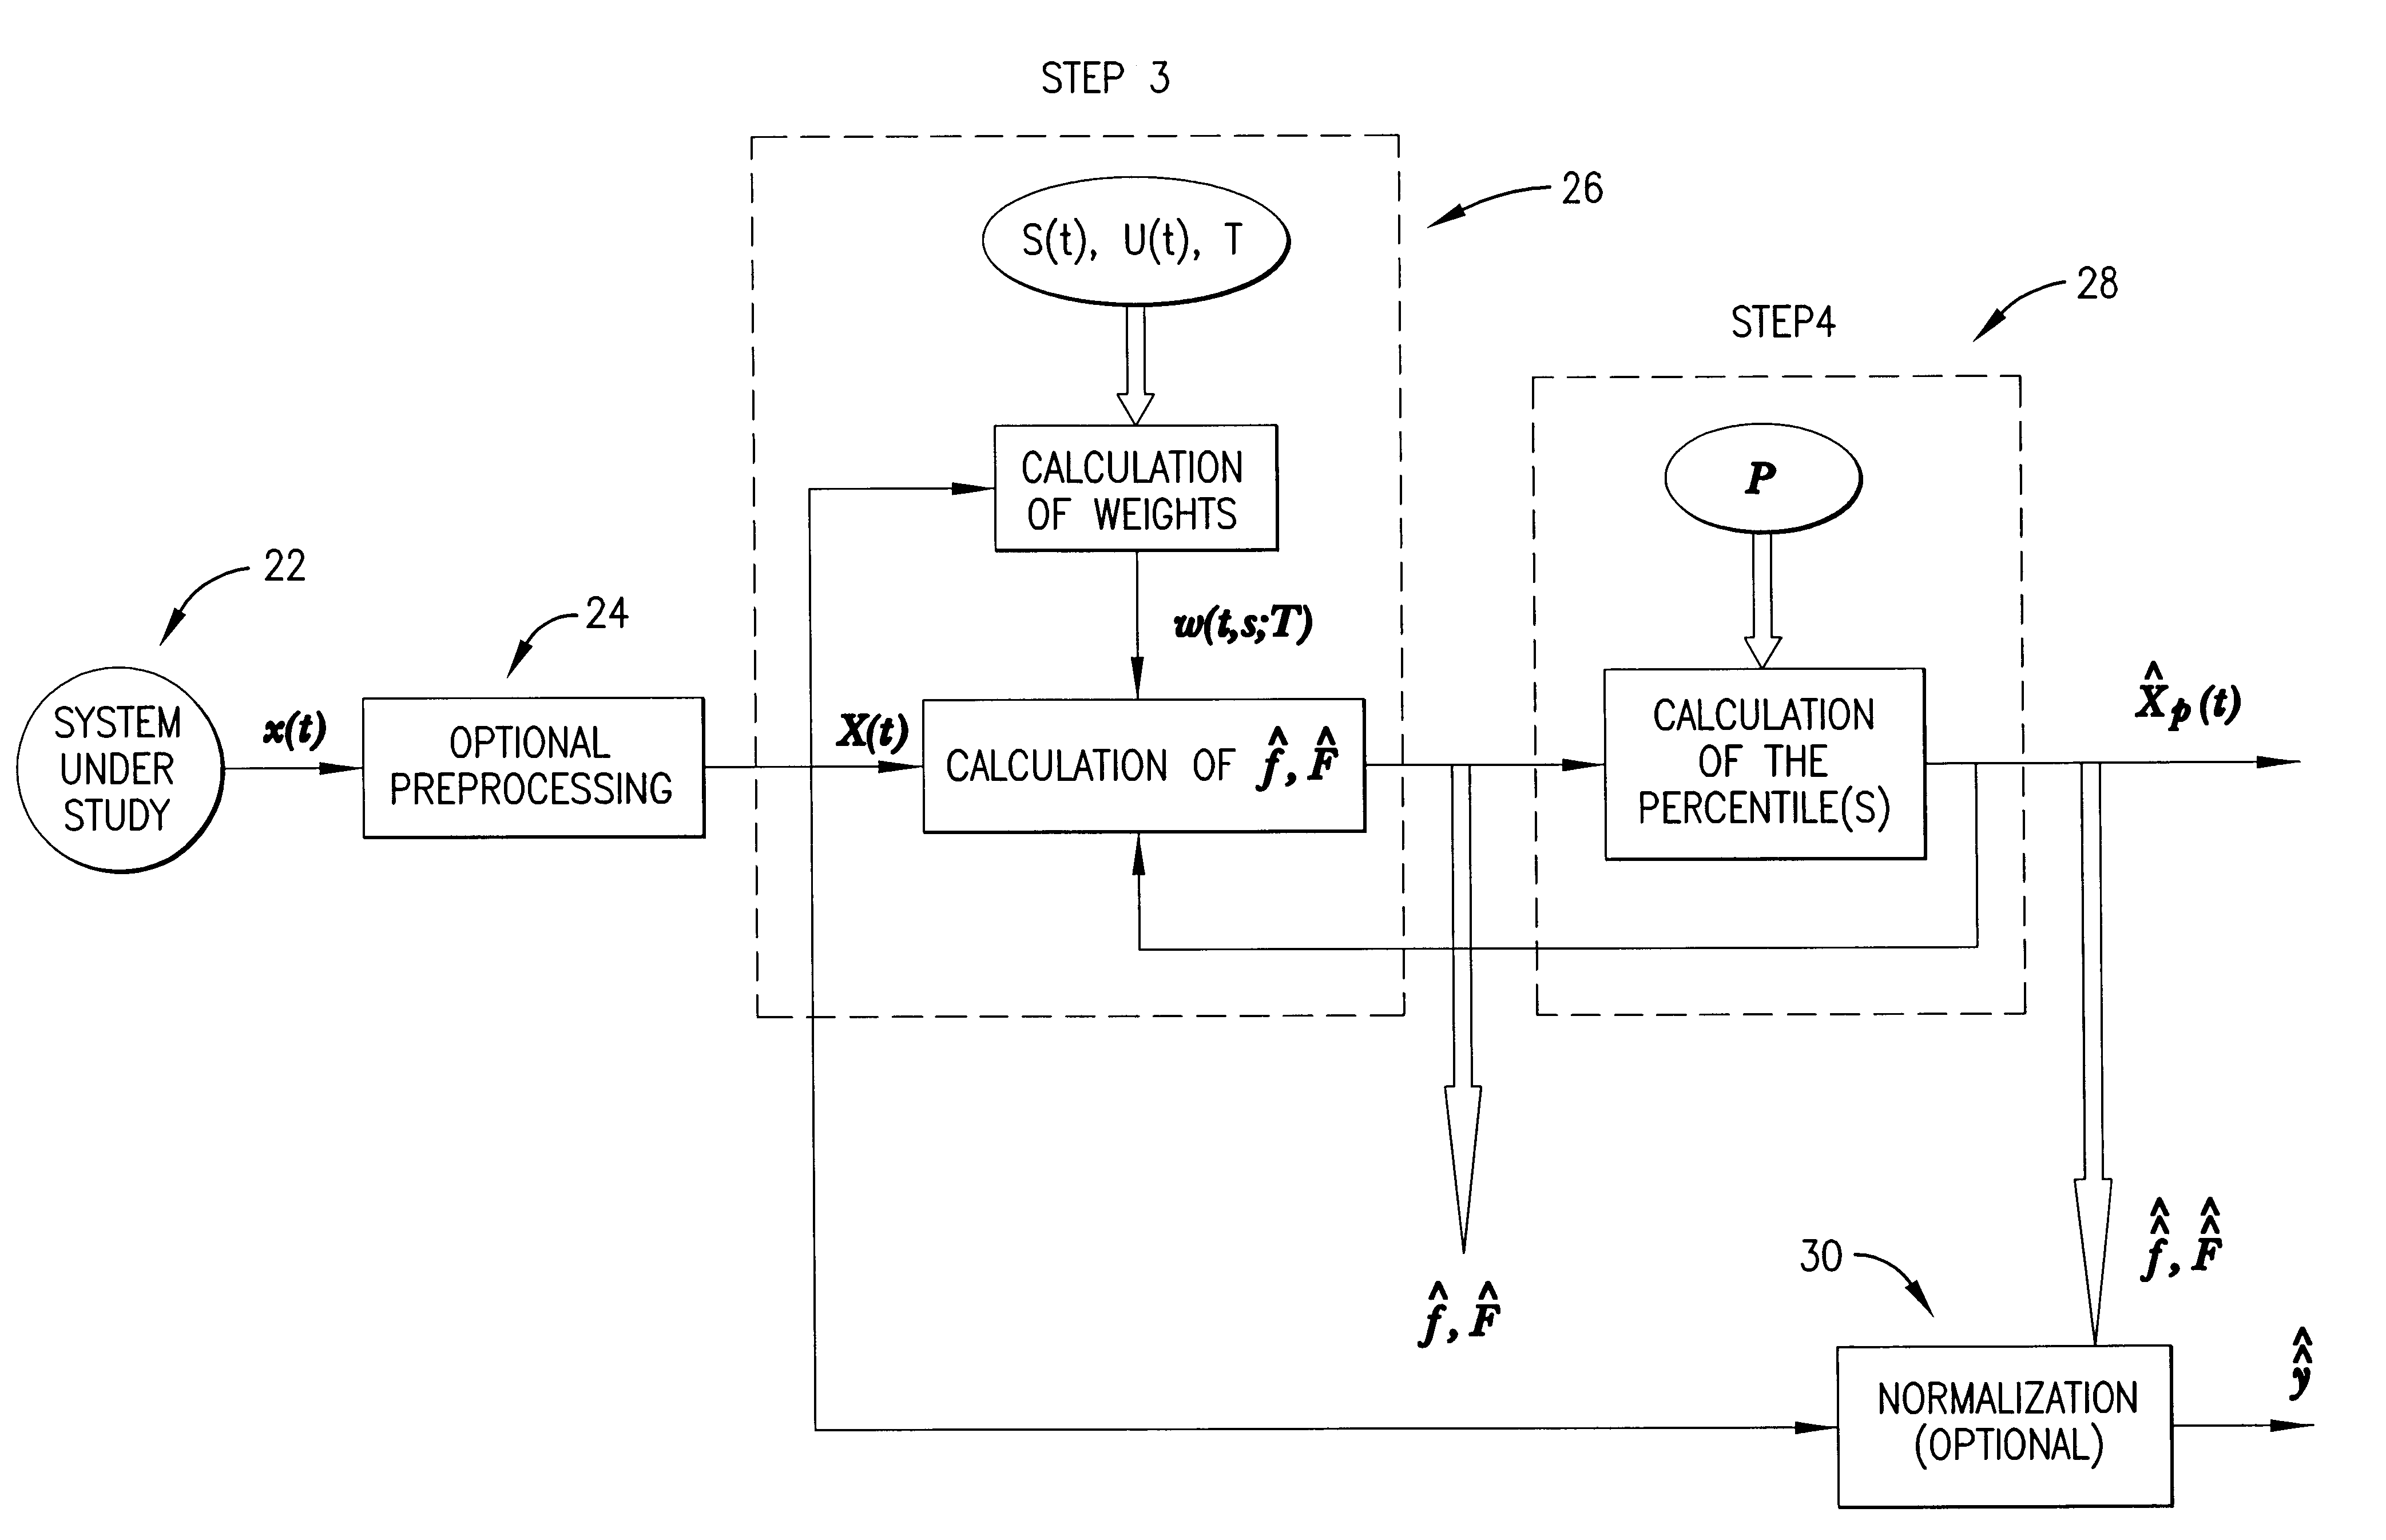
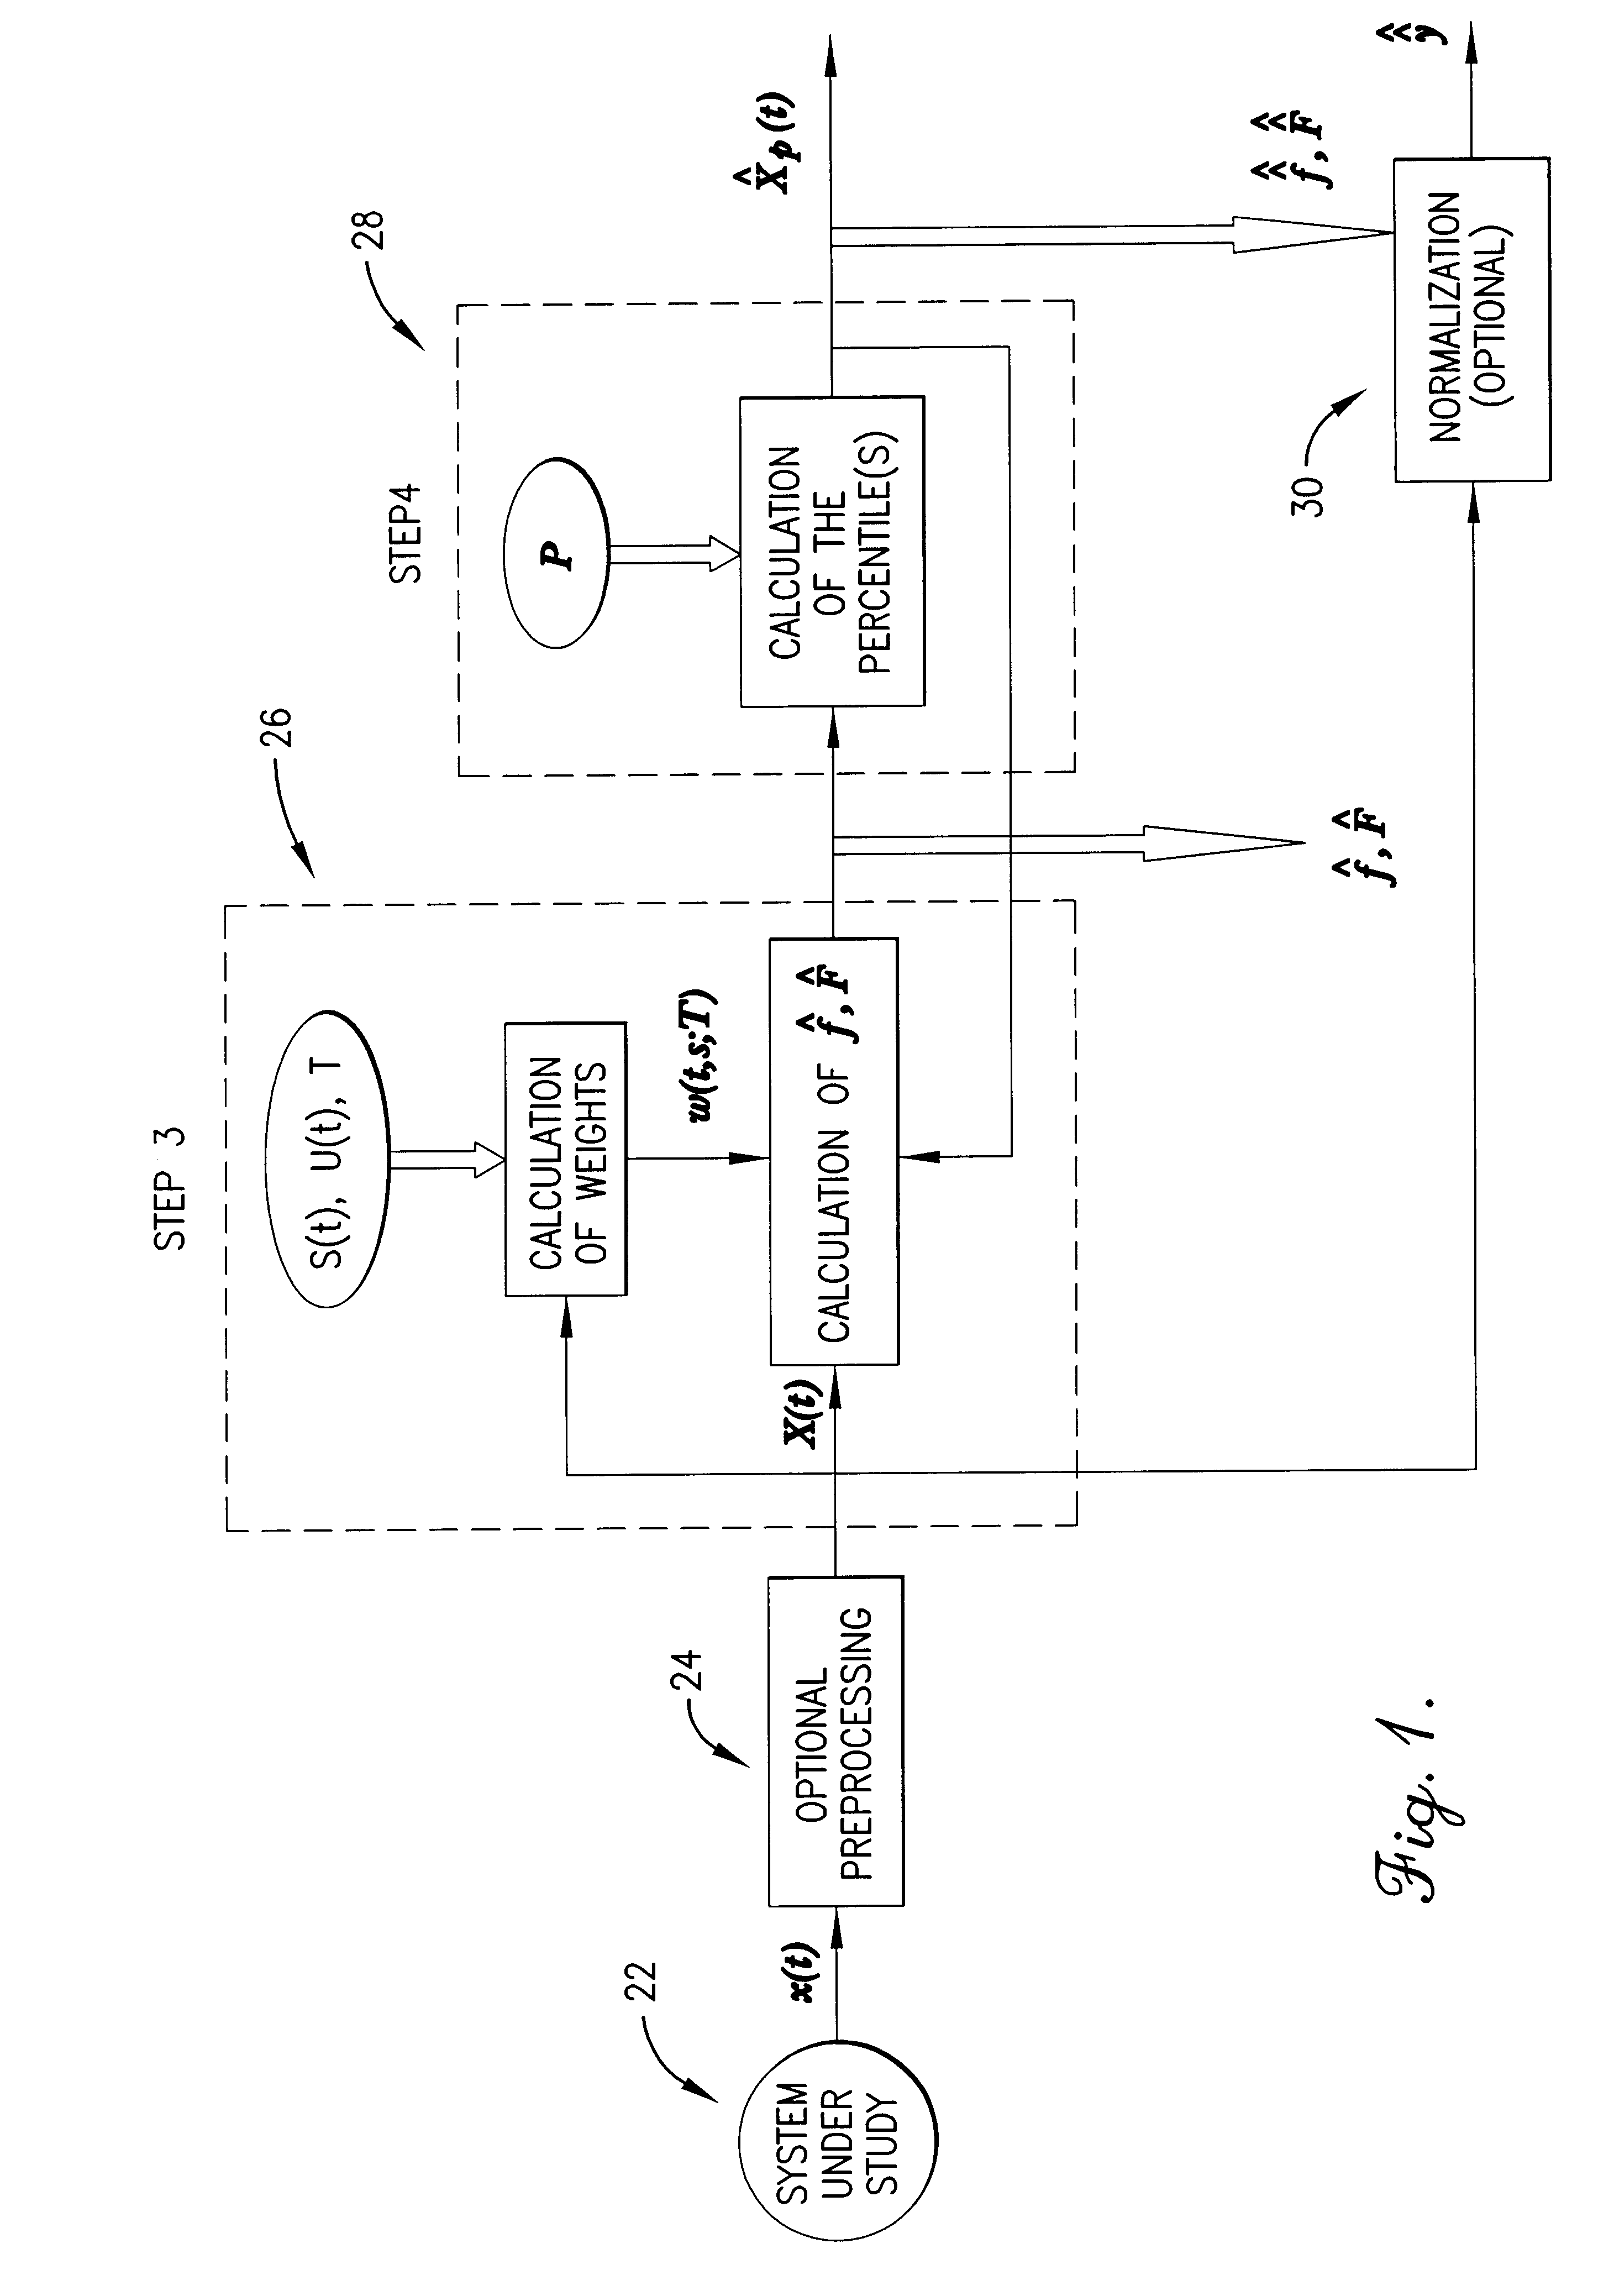
In an exemplary illustration of application of the present invention to financial analysis, a three-dimensional raw input signal, x(t), is received such that, as shown in FIG. 4, x(t) is the price at time t of three stocks (IBM, GM, and MRK) during a 360 minute period on Oct. 23, 1994.

Pre-processing is then performed on x(t) to yield a feature signal, X(t), as shown in FIG. 5, such that X(t) is the value of a portfolio at time t comprising the three stocks of interest: X(t)=300*GM+100*IBM+80*MRK.

Next, as time, t, evolves, the time-weight function, w(t,s), is defined for use at each time point. In the present example, w is defined so that the time-weight is a moving square window of length T=100 minutes. In practice, more complicated time-weights could be used that include a dependence upon an auxiliary signal such as oil prices and supplies which may have a direct impact in GM stock prices by influencing consumer preferences and cash availability. Another time-weig...


PUM

PropertyMeasurementUnit
timeaaaaaaaaaa
voltageaaaaaaaaaa
time-weighted functionaaaaaaaaaa

Abstract

A method, computer program, and system for real-time signal analysis providing characterization of temporally-evolving densities and distributions of signal features of arbitrary-type signals in a moving time window by tracking output of order statistic filters (also known as percentile, quantile, or rank-order filters). Given a raw input signal of arbitrary type, origin, or scale, the present invention enables automated quantification and detection of changes in the distribution of any set of quantifiable features of that signal as they occur in time. Furthermore, the present invention's ability to rapidly and accurately detect changes in certain features of an input signal can also enable prediction in cases where the detected changes associated with an increased likelihood of future signal changes.

Description

COMPUTER PROGRAM LISTING APPENDIXA computer program listing appendix containing the source code of a computer program that may be used with the present invention is incorporated herein by reference and appended hereto as one (1) original compact disk, and an identical copy thereof, containing a total of forty-one (41) files as follows:1. Field of the InventionThe present invention relates generally to methods, computer programs and systems for automated signal analysis providing rapid and accurate detection, prediction, or quantification of changes in one or more signal features, characteristics, or properties as they occur. More particularly, the present invention relates to a method, computer program, or system for automated real-time signal analysis providing characterization of temporally-evolving densities and distributions of signal features of arbitrary-type signals in a moving time window by tracking output of order statistic filters (also known as percentile, quantile, or r...

Claims


Application Information

Patent Timeline
Patent Type & Authority Patents(United States)
IPC IPC(8): G06F17/18G16B40/10
CPCG06F17/18G06K9/00536G16H50/50G16H50/20G16B40/00G16B40/10G06F2218/12G06F17/10
Inventor NIKITIN, ALEXEI V.FREI, MARK G.BHAVARAJU, NARESH C.OSORIO, IVAN
Owner FLINT HILLS SCI L L C
Learn More